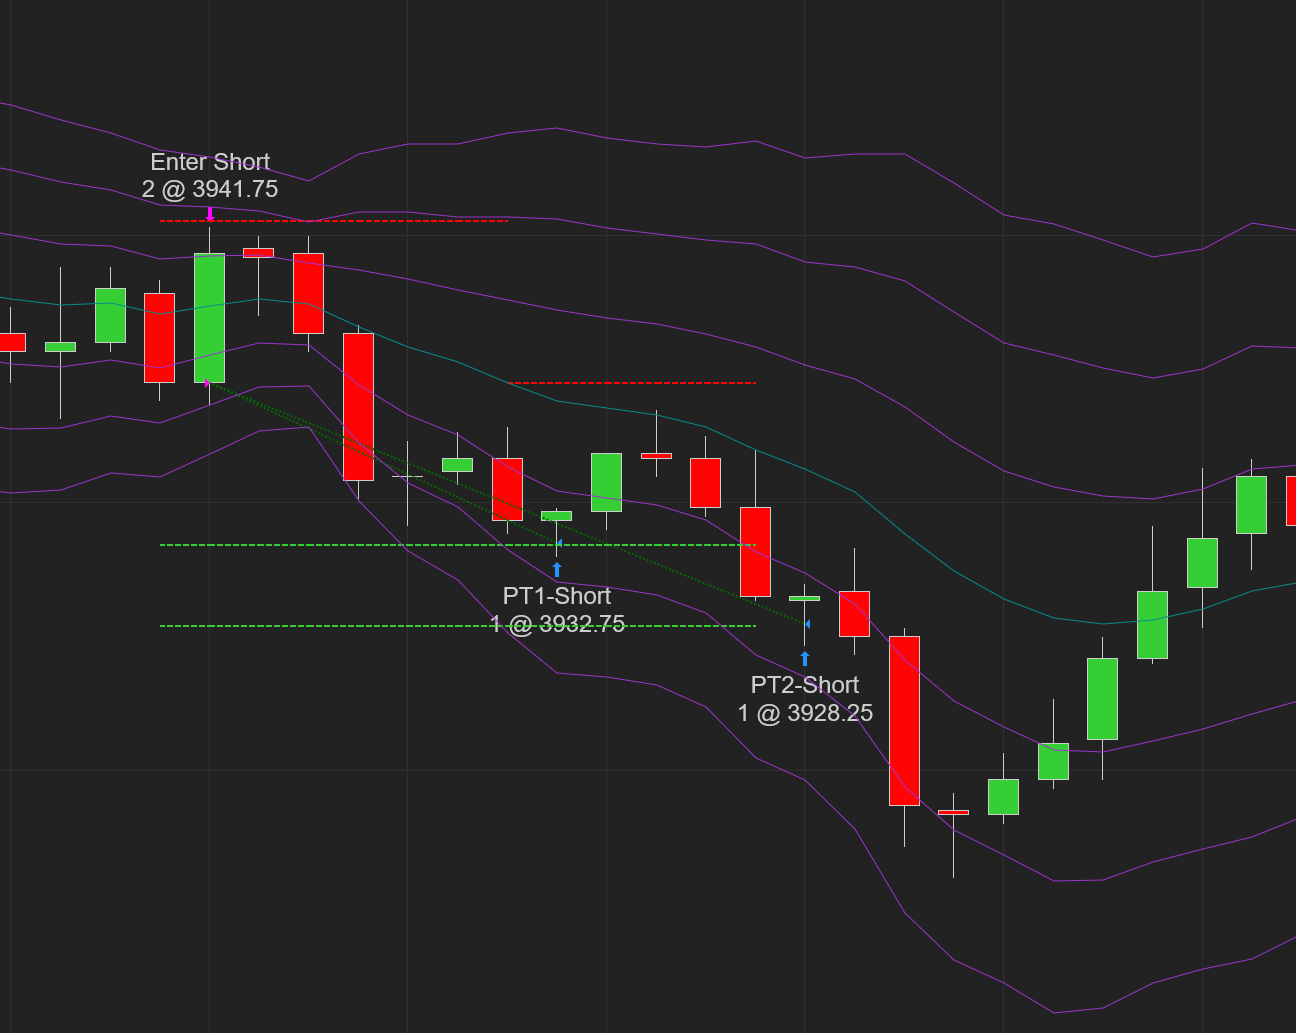
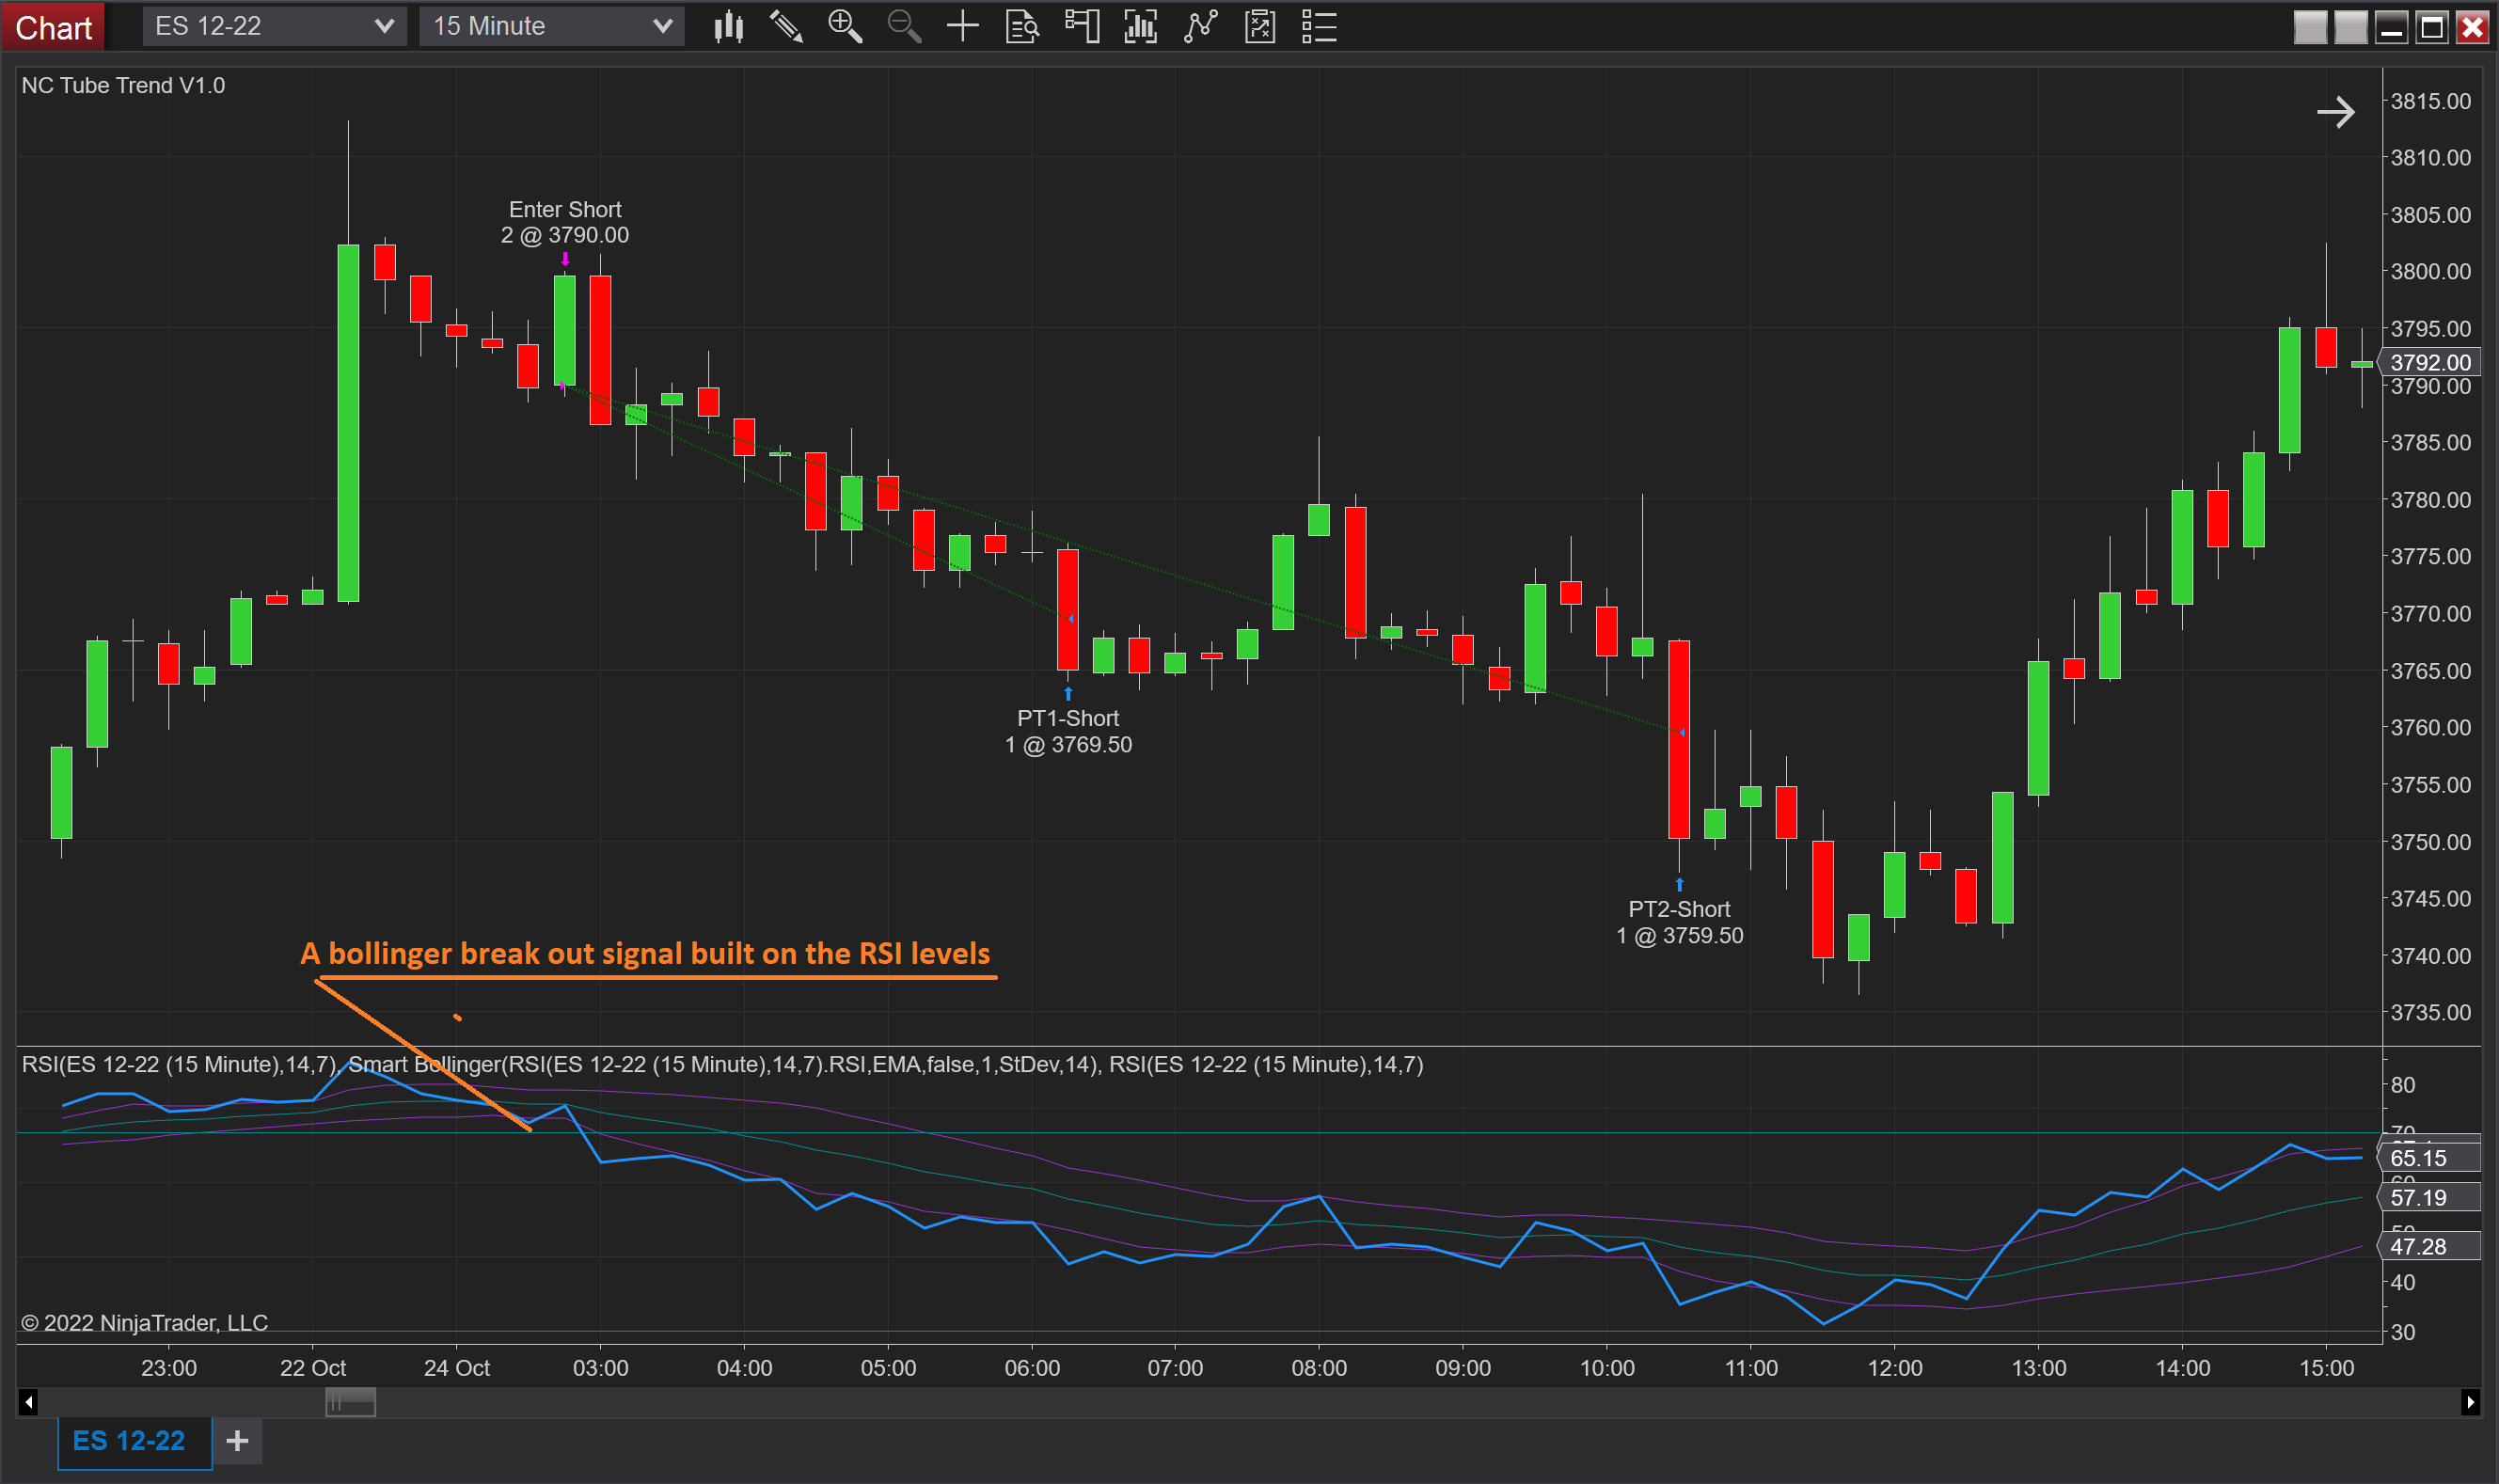
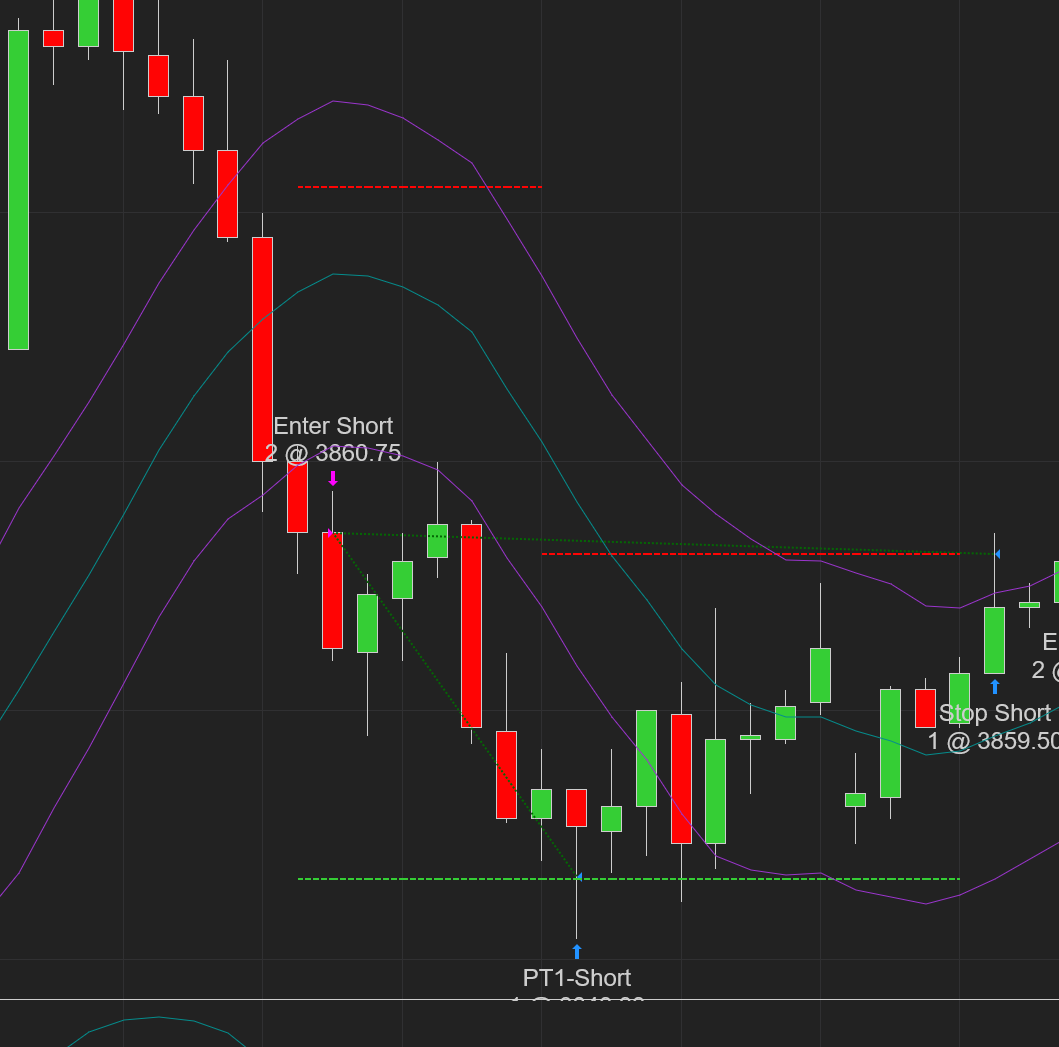
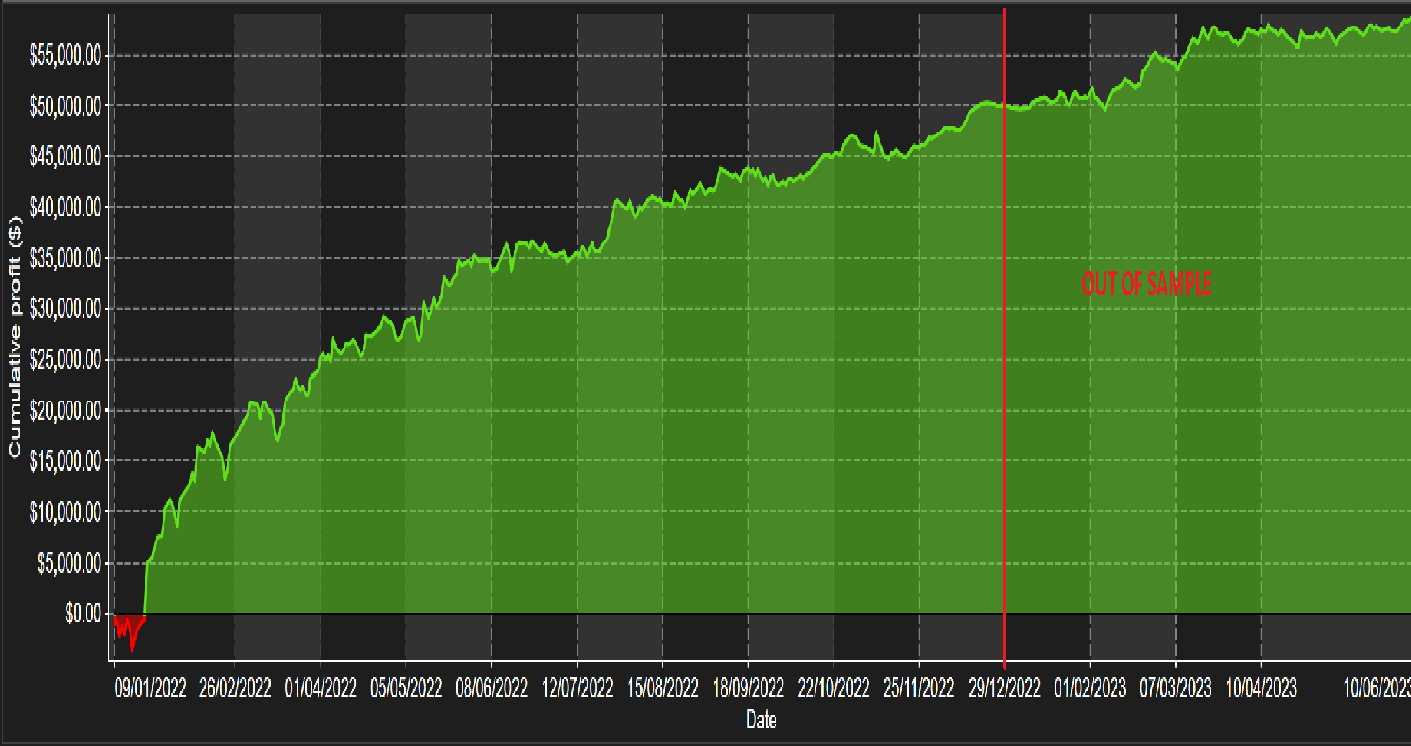
Simplicity is the way to go quite often and this system is not an exception to this amazing coincidence. This system is built to look for trend moves and stay safe and sideways during periods of less dynamic market activity. System offers a few approaches to how the channel or the tube is built either using a variety of moving averages such as EMA, HMA, TMA, SMA, VWMA, TEMA, WMA and offsetting the channel sides by the use of a standard deviation or an ATR. The entry occurs at channel break out allowing users to set two profit targets and a stop using multiples of current ATR values. Once your first profit target is reached the strategy automatically moves the stop loss to break even. The position size for each split is a variable and it is up the user to manage this risk. The strategy also allows to either close or reverse the existing position at the occurrence of an opposite signal. This fact is also allowed to be ignored. Another exiting feature that is present is the middle channel exit. Finally the strategy is supplied with an extendable filter block. Out of the box users are presented with an MACD and RSI filters. It is possible to extend this block with infinite number of variations should you wish to acquire the source code license or become a member to NinjaCoding development services. Overall the strategy can be optimized providing numerous parameter combinations. Feel free to explore the provided validations and settings for more information.
In Sample part of the test is the period where we optimize the strategy. Optimization is a process that is believed to find the best strategy parameters for that particular period.
However these parameters can fail miserably on the Out-of-Sample part of the test which is a mimic of the live performance.
In order to test the system’s potential robustness we try and see good Out - of Sample results as well which can be a good sign of that the parameters which we found for the In-Sample part of the test can actually be acceptable for the live trading.
Each validation is done with a 1 contract test and is provided with at least 3 validation tests to demonstrate potential system stability.
We provide 3 tempalte files with the system that you are free to use for your own trading. If you set up the exact same test environment and run these settings you will get very similar results to those demonstrated on our tests.
Please see video for more information!
8 | MNQ 13.01.2020 - 12.02.2021 |
11 | GC 27.01.2020 - 16.02.2021 |
12 | SI 21.01.2020 - 16.02.2021 |
13 | MIJY 13.01.2020 - 09.02.2021 |
In-Sample | Out-of-Sample | |
---|---|---|
Net Profit | 12016.50 | 4594.00 |
Average Trade | 98.50 | 76.57 |
Number of trades | 122.00 | 60.00 |
Trades per Month | 15.90 | 11.40 |
Trades per Year | 193.45 | 138.70 |
First Trade Open Date | 13.01.2020 | 10.09.2020 |
Last Trade Open Date | 27.08.2020 | 12.02.2021 |
Profit Factor | 2.67 | 1.94 |
Sharp | 1.28 | 1.10 |
Max Draw Down | -1981.50 | -1024.00 |
Draw Down Below 0 Line | -1193.50 | -1193.50 |
Average Draw Down | -451.65 | -576.43 |
Average Draw Down Days | 9.42 | 15.04 |
Max Draw Down Days | 33.25 | 21.46 |
Win Rate | 64.75 | 61.67 |
Average Win | 243.34 | 256.68 |
Max Cons Win | 9.00 | 7.00 |
Max Win | 585.00 | 679.00 |
Loss Rate | 21.31 | 25.00 |
Average Loss | -277.21 | -326.87 |
Max Cons Loss | 2.00 | 3.00 |
Max Loss | -1492.00 | -654.00 |
Supported 24-7
Tested & Validated