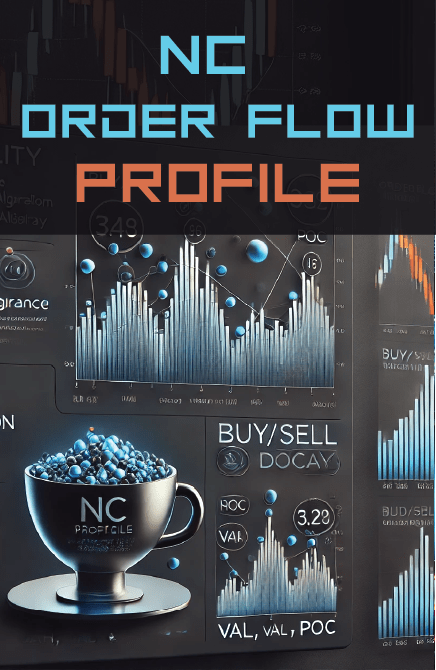


Granularity The indicator allows users to use large range bars by combining price into groups, offering a detailed and customizable view of market data. Buy/Sell Imbalance Algorithm Analyzes every tick to determine whether it hits the best bid or ask. Groups ticks into buy or sell categories. Allows users to set a percentage value for detecting directional imbalances. Plots imbalances when one group's volume exceeds the other's by the set percentage value. Delta Calculation and Display The bottom bar displays delta using the same algorithm as the buy/sell imbalance. Shows the percentage that this delta constitutes of the total volume. Volume Area High (VAH), Volume Area Low (VAL), and Point of Control (POC): VAH, VAL, and POC are exposed for integration with trading strategies, providing critical reference points for decision-making.
