NC Swing Volume Profile Indicator for NinjaTrader 8
A Volume Profile in Every Swing Leg
A Volume Profile in Every Swing Leg
Why NC Swing Profile
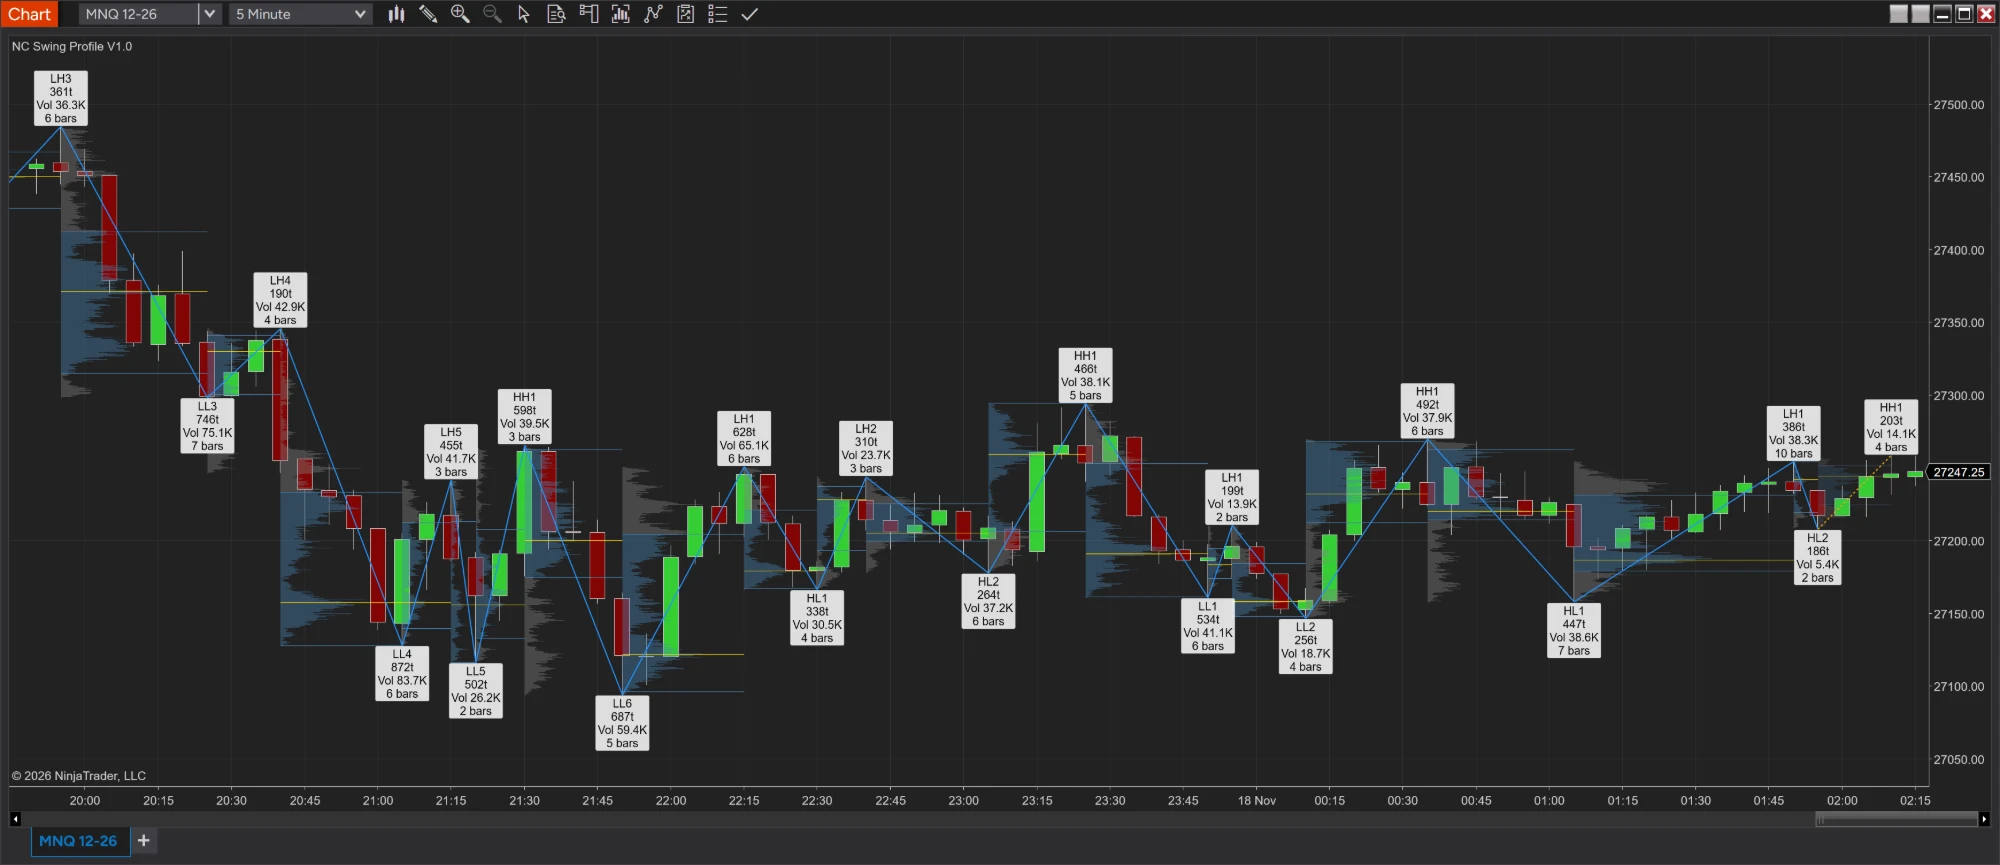
A swing line joins the highs and lows, but it says nothing about where each leg's volume traded or who was pushing. NC Swing Profile draws a volume profile inside every swing leg, with its POC, value area and delta, and gives every swing a box with its structure and numbers. Confirmed swings never repaint, and the leg that's still forming is drawn apart. No Tick Replay needed.
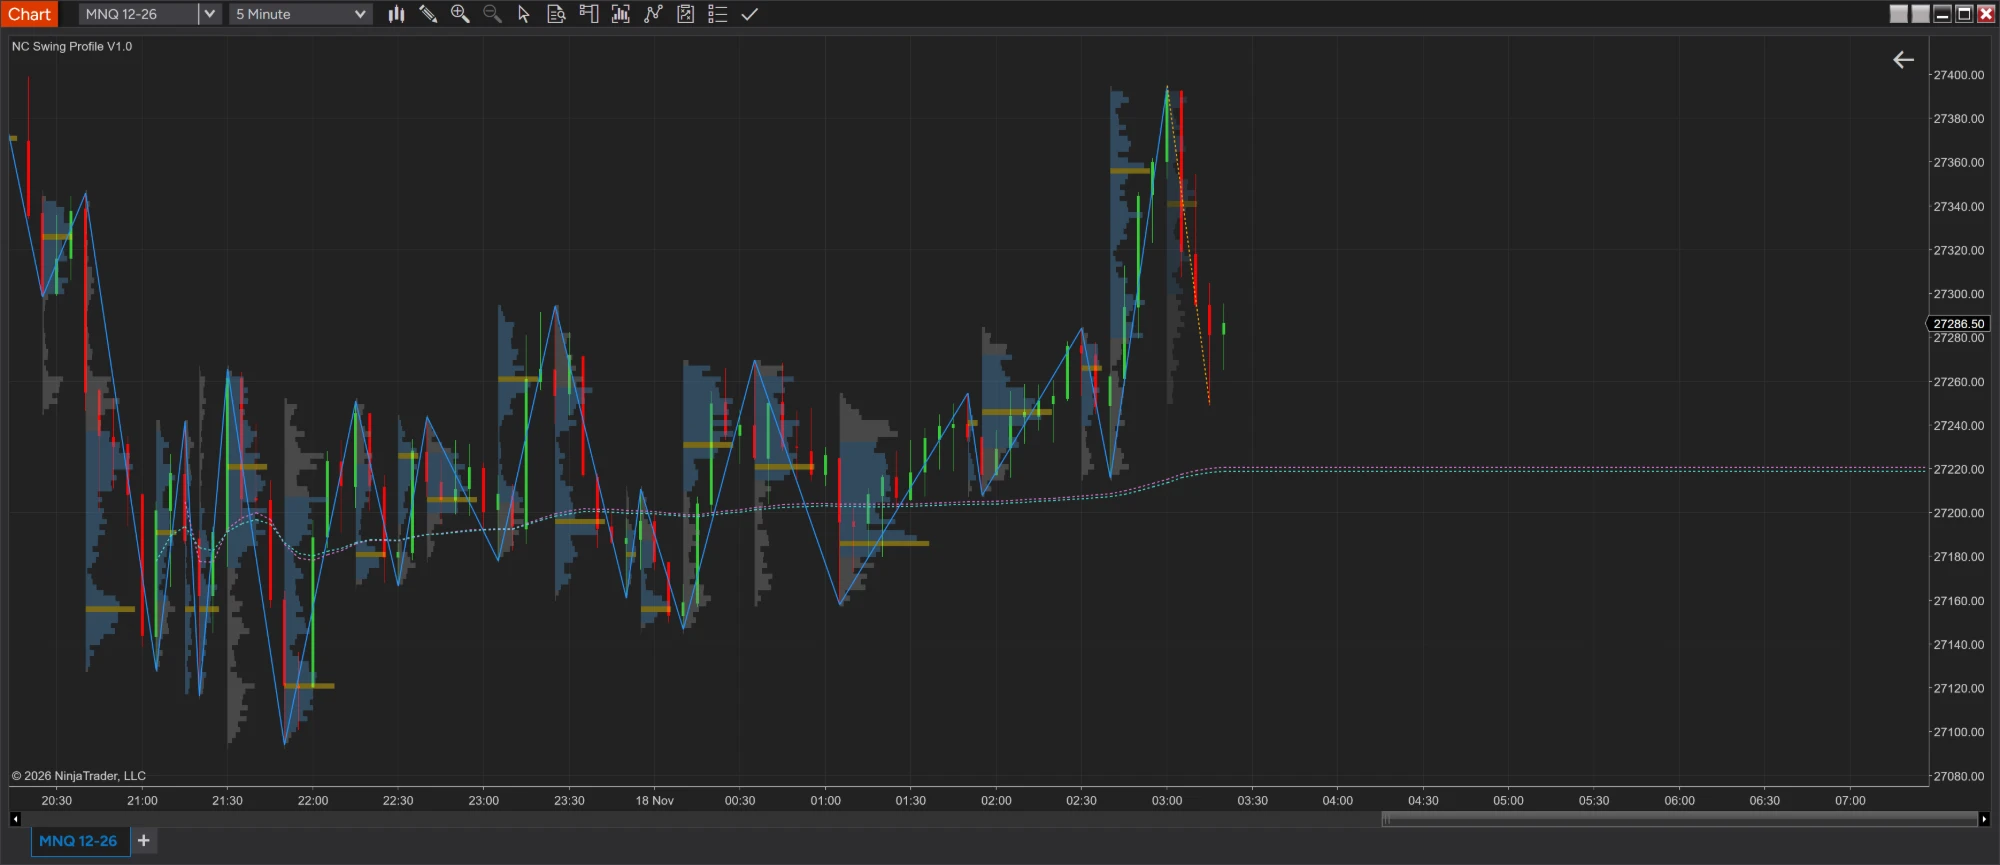
MNQ 12-26, 5-minute chart. Click any chart on this page to open it full size.
POC, value area and delta rows inside each leg, and levels that run until price touches them.
HH, HL, LH and LL with a count, double tops and bottoms, and BOS or CHoCH on every break.
Confirmed swings never repaint. The leg that's forming is dotted, with its own boxes and profile.
Pay once and keep it. Change anything yourself or with AI like Claude.
Everything in version 1.0
Zoom in
Each leg's profile adds up the volume traded at every price between its two swings, from 1-tick data by default. Row Granularity sets how many ticks make one row: 1 for every price, more for bolder bands.
One row per tick: every price the leg traded.
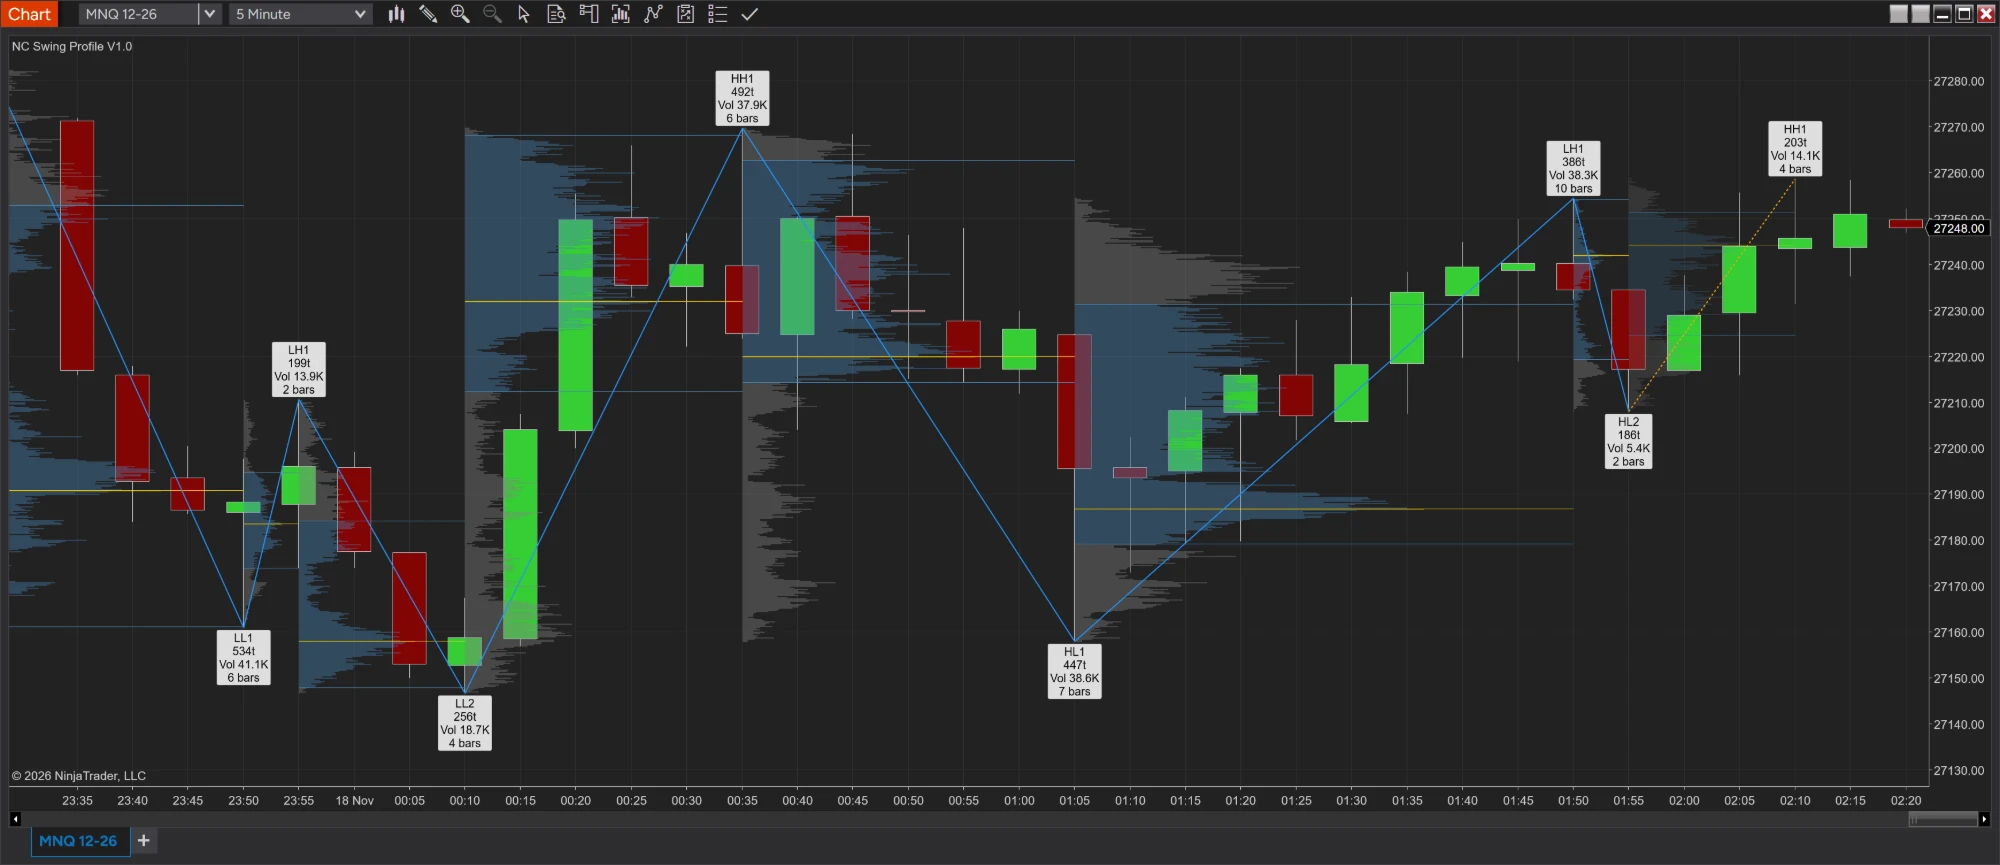
Several ticks per row: bolder bands and a thick POC.
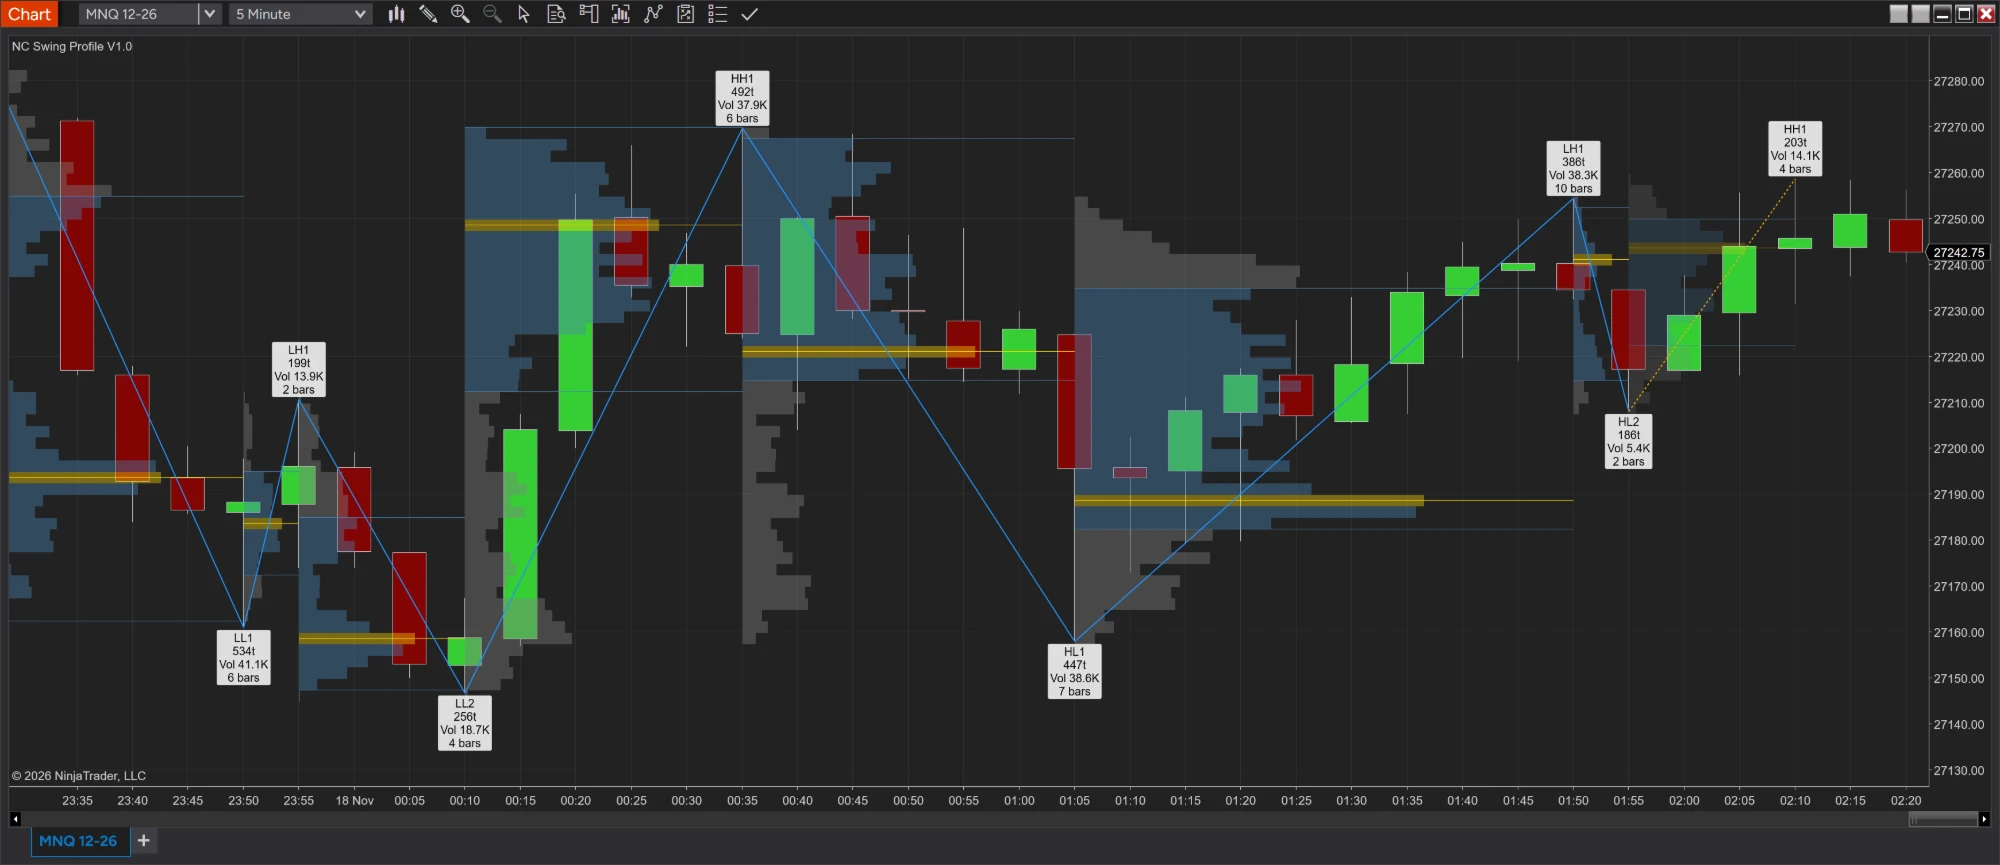
The same MNQ 5-minute legs, with 1-tick rows and with wider rows.
A leg runs from one swing to the next, both swing bars included. Its profile is drawn behind the zig-zag and the boxes, from the leg's start to its end.
Extend Levels keeps the POC, VAH or VAL of every finished leg running right until price touches it, so naked POCs and untouched value areas stay on your chart. A wick counts as a touch, and a touched line stays drawn up to the touch.
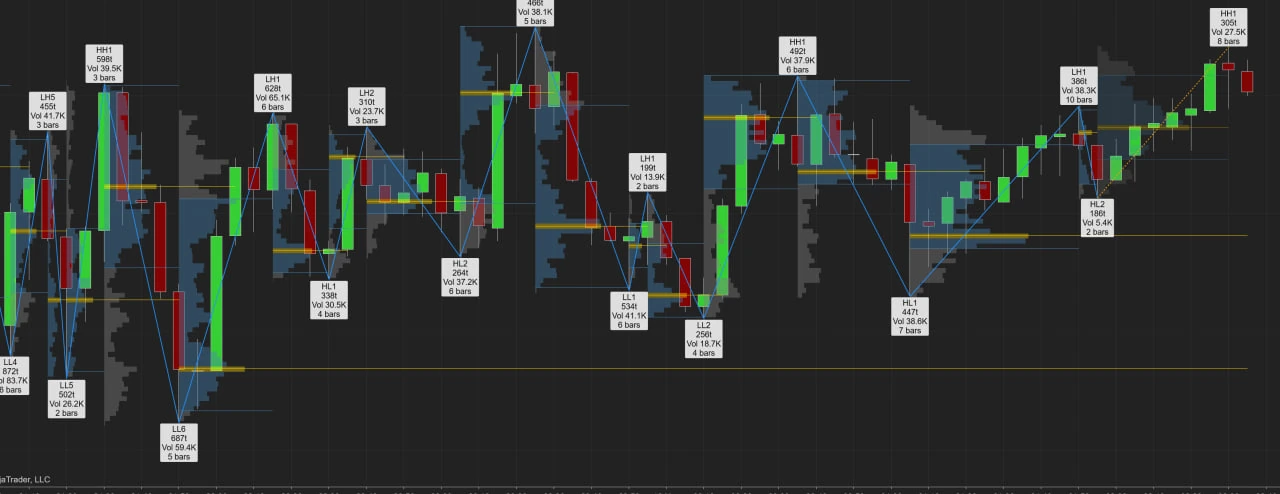
Extend Levels POC: each gold line is a finished leg's POC, running right until price comes back to it.
How the swings work
Swings are committed only on closed bars, so a confirmed swing is the same live and after a reload. Two modes and four deviation units, so the same indicator works on ES, CL, 6E or stocks.
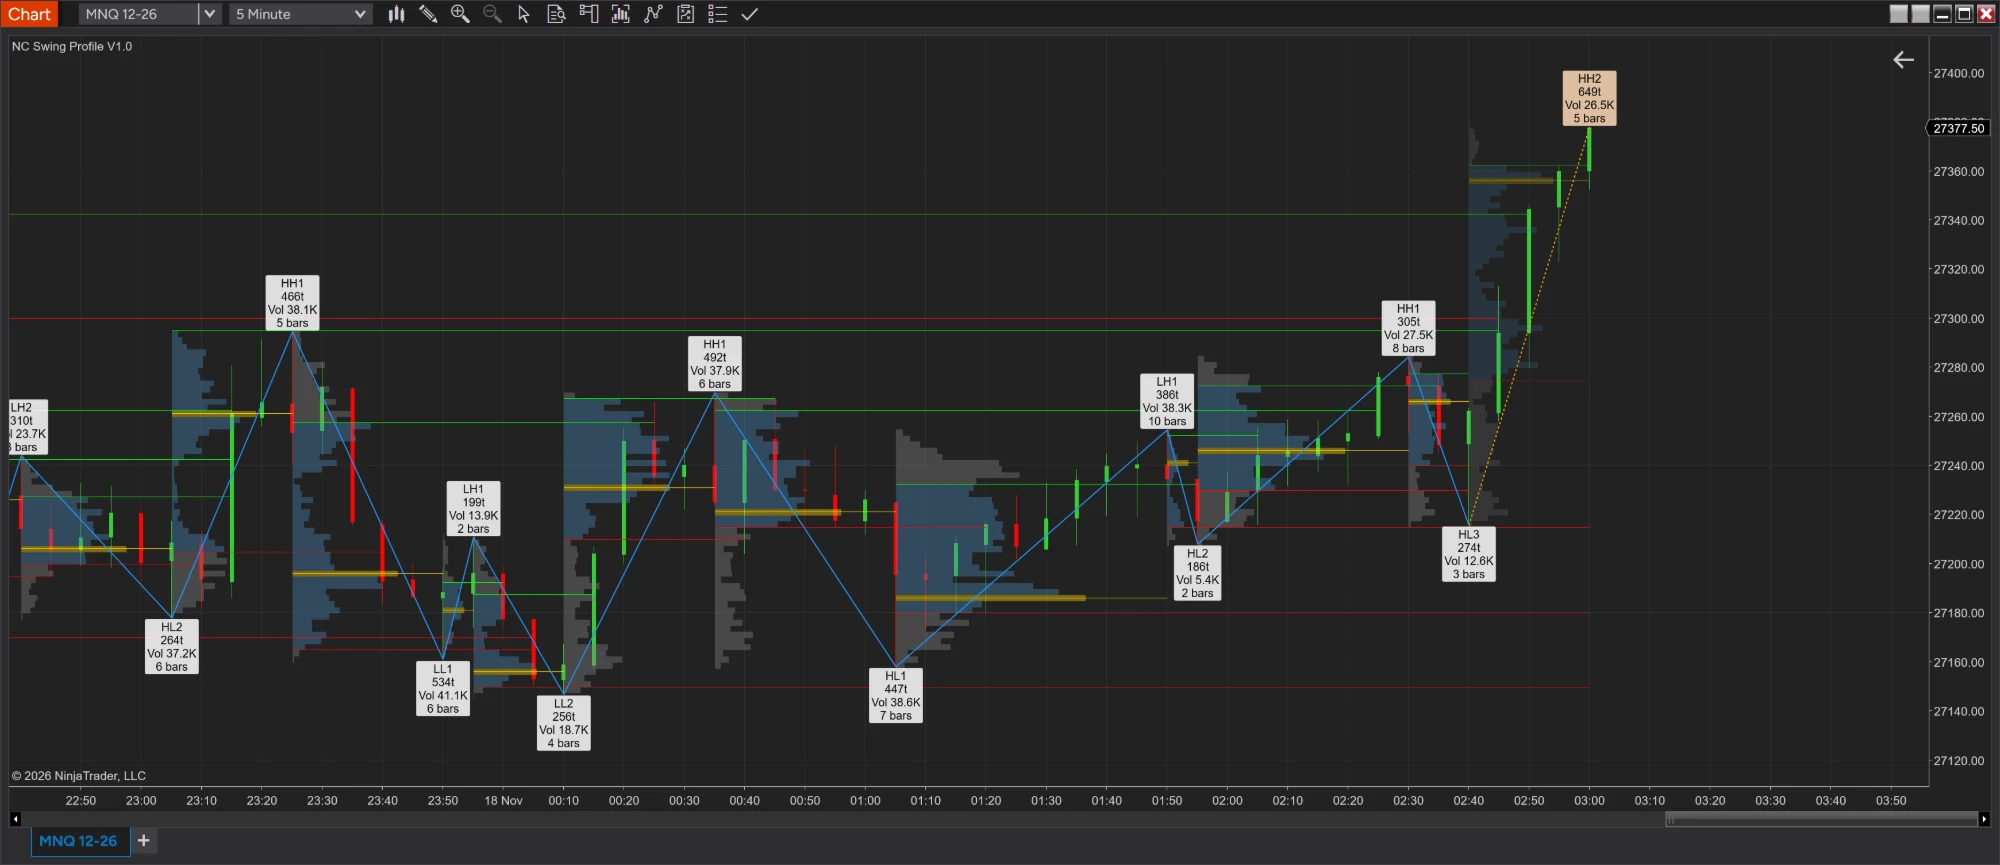
HH2, top right, is still forming: a dotted orange leg, a light-orange box and a live profile. The green and red lines are the VAH and VAL of finished legs, waiting for price.
Each swing is labelled HH, HL, LH or LL against the previous swing on the same side, with a count: HH2 is the second higher high in a row. A swing within Double Top/Bottom Tolerance of the previous one on its side (2 ticks by default) also gets DT or DB.
The numbers
Every swing's box can show up to fourteen rows, from its structure to its value area. Switch on the ones you read and leave the rest off. Swings that are still forming get the same box in light orange.
| Row | Looks like | What it shows | Default |
|---|---|---|---|
| Structure label | HH2 DT | Higher high, lower high, higher low or lower low with its count, plus DT or DB for a double top or bottom | On |
| Leg size | 361t · 3.0 ATR · $1,250 | In ticks, points, percent, ATR or dollars. Dollars is the leg's distance × point value × your contracts. | On |
| Retracement | Ret 67% | This leg's size against the leg before it | Off |
| Speed | Spd 4t/bar | Leg size per bar | Off |
| Leg volume | Vol 67.8K | All the volume traded in the leg | On |
| Avg volume per bar | Avg 13.6K/bar | The leg's volume divided by its bars | Off |
| Volume change | Vol chg +40% | Against the previous leg in the same direction | Off |
| Volume per tick | V/t 125 | Volume for every tick the leg covered | Off |
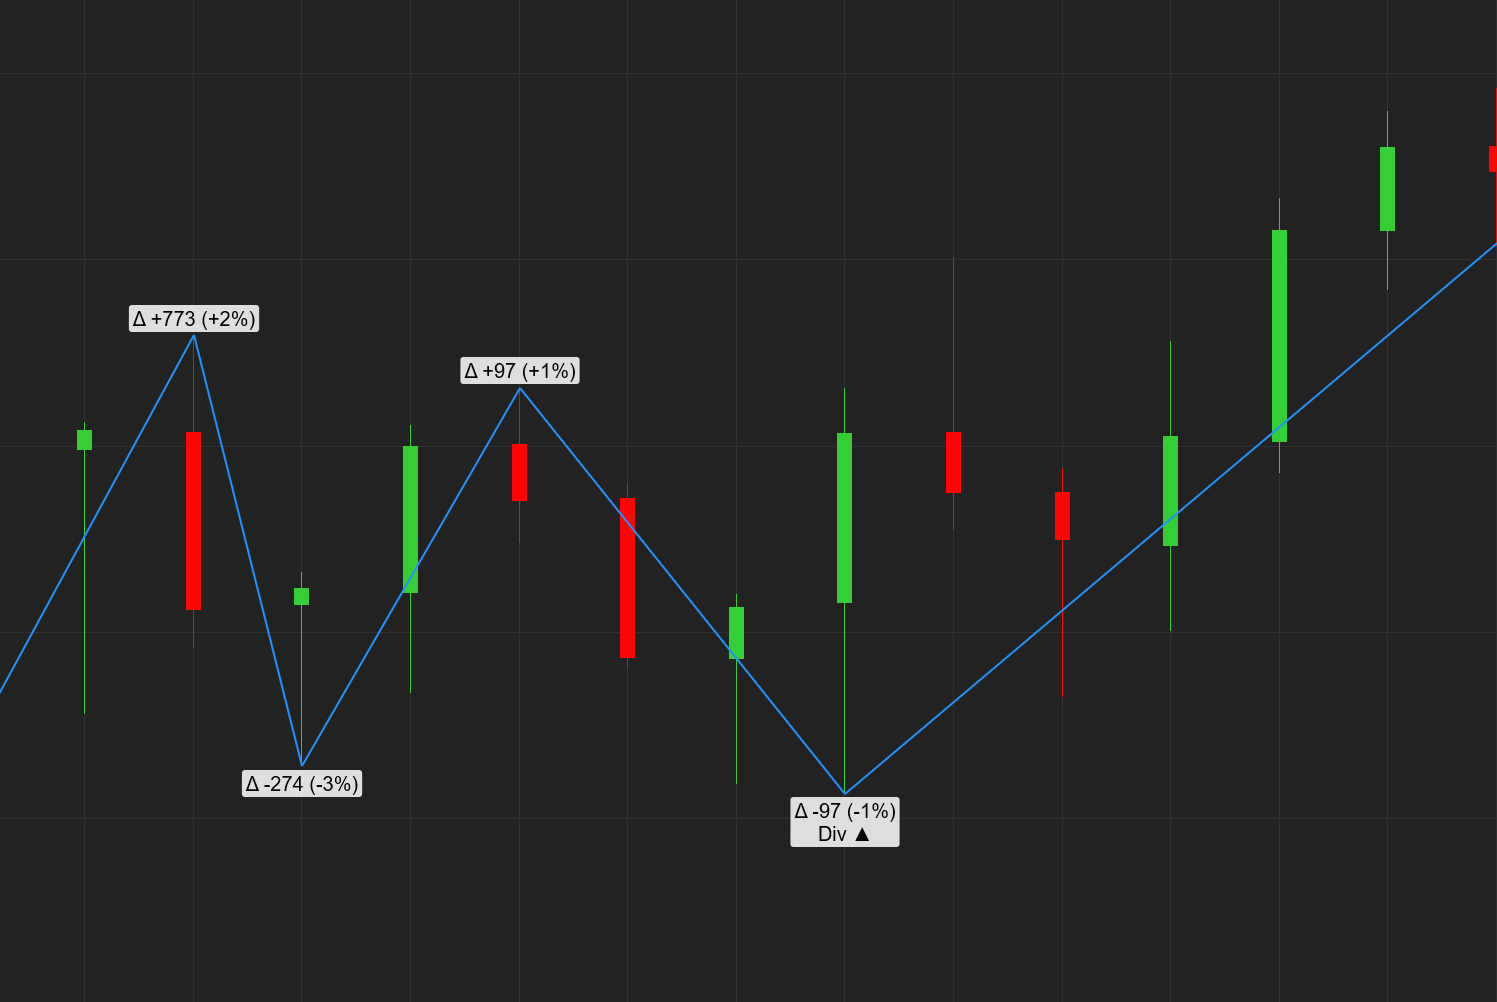
| Delta | Δ +773 (+2%) | Buying minus selling, and its share of the leg's volume | Off |
| Divergence | Div ▼ · Div ▲ | A higher high on weaker delta than the last up leg, or a lower low with less selling than the last down leg | Off |
| Bars | 6 bars | Bars in the leg, both swing bars included | Off |
| Duration | 30m | From the open of the leg's first bar to the close of its last | Off |
| POC | POC 5012.25 | The leg's busiest price | Off |
| Value area | VA 5008.50–5014.00 | The leg's value area, from VAL to VAH | Off |
Each leg's move in dollars for the contracts you set.
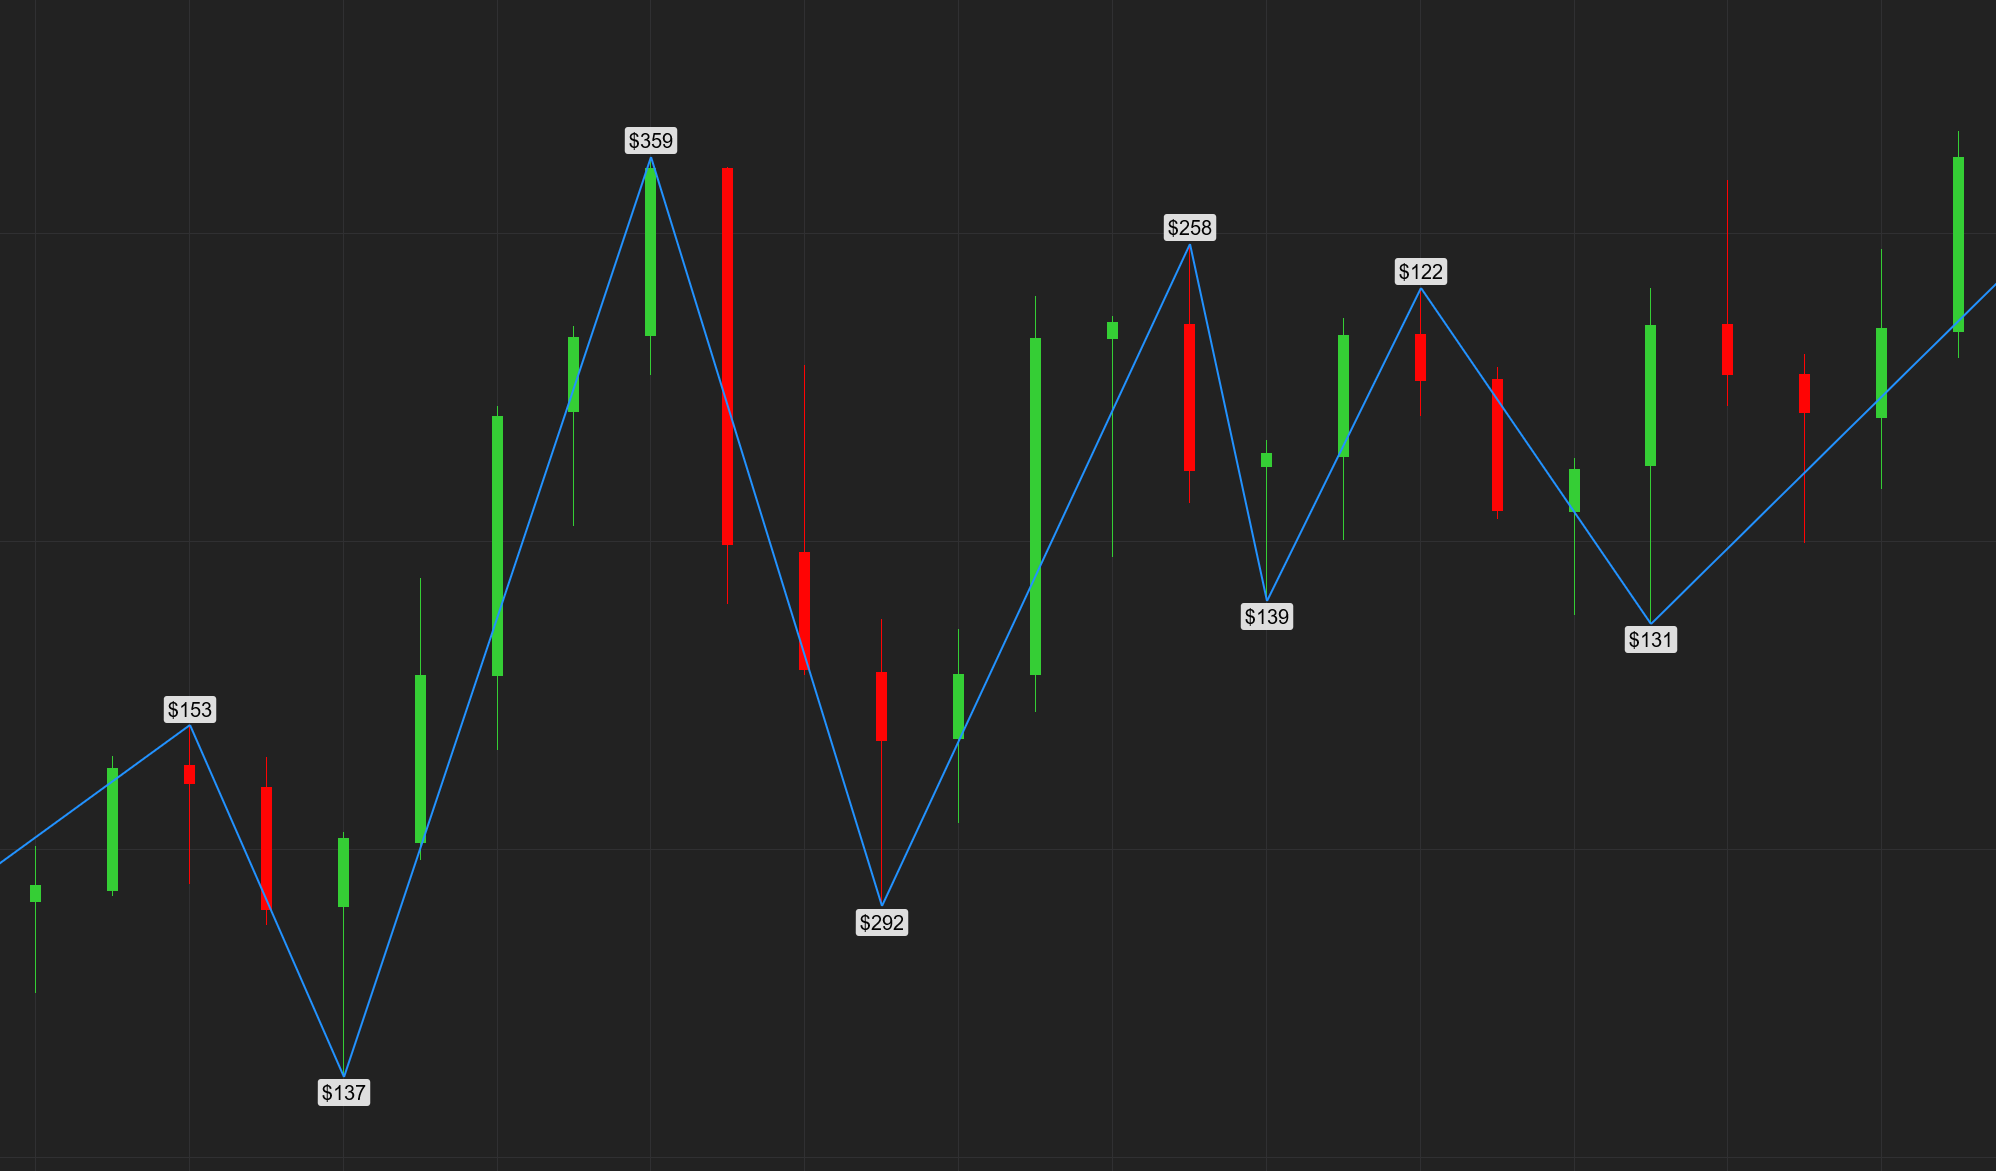
Div ▲ on a lower low with less selling than the down leg before it.
The boxes stay inside Auto Scale, so they always fit on screen. Font size, colors and opacity are settings.
Around the swings
VWAP from the last swing high and low, breakout levels with BOS and CHoCH, Fibonacci on the forming and the formed leg, and alerts.
Two anchored VWAPs, one from the last swing high and one from the last swing low, built from each bar's typical price. They re-anchor when a new swing appears and run flat into the future. Lookback (legs) adds up the last few legs, and Collapse Into One draws a single curve from both.
From the latest swing high and low, then flat to the right.
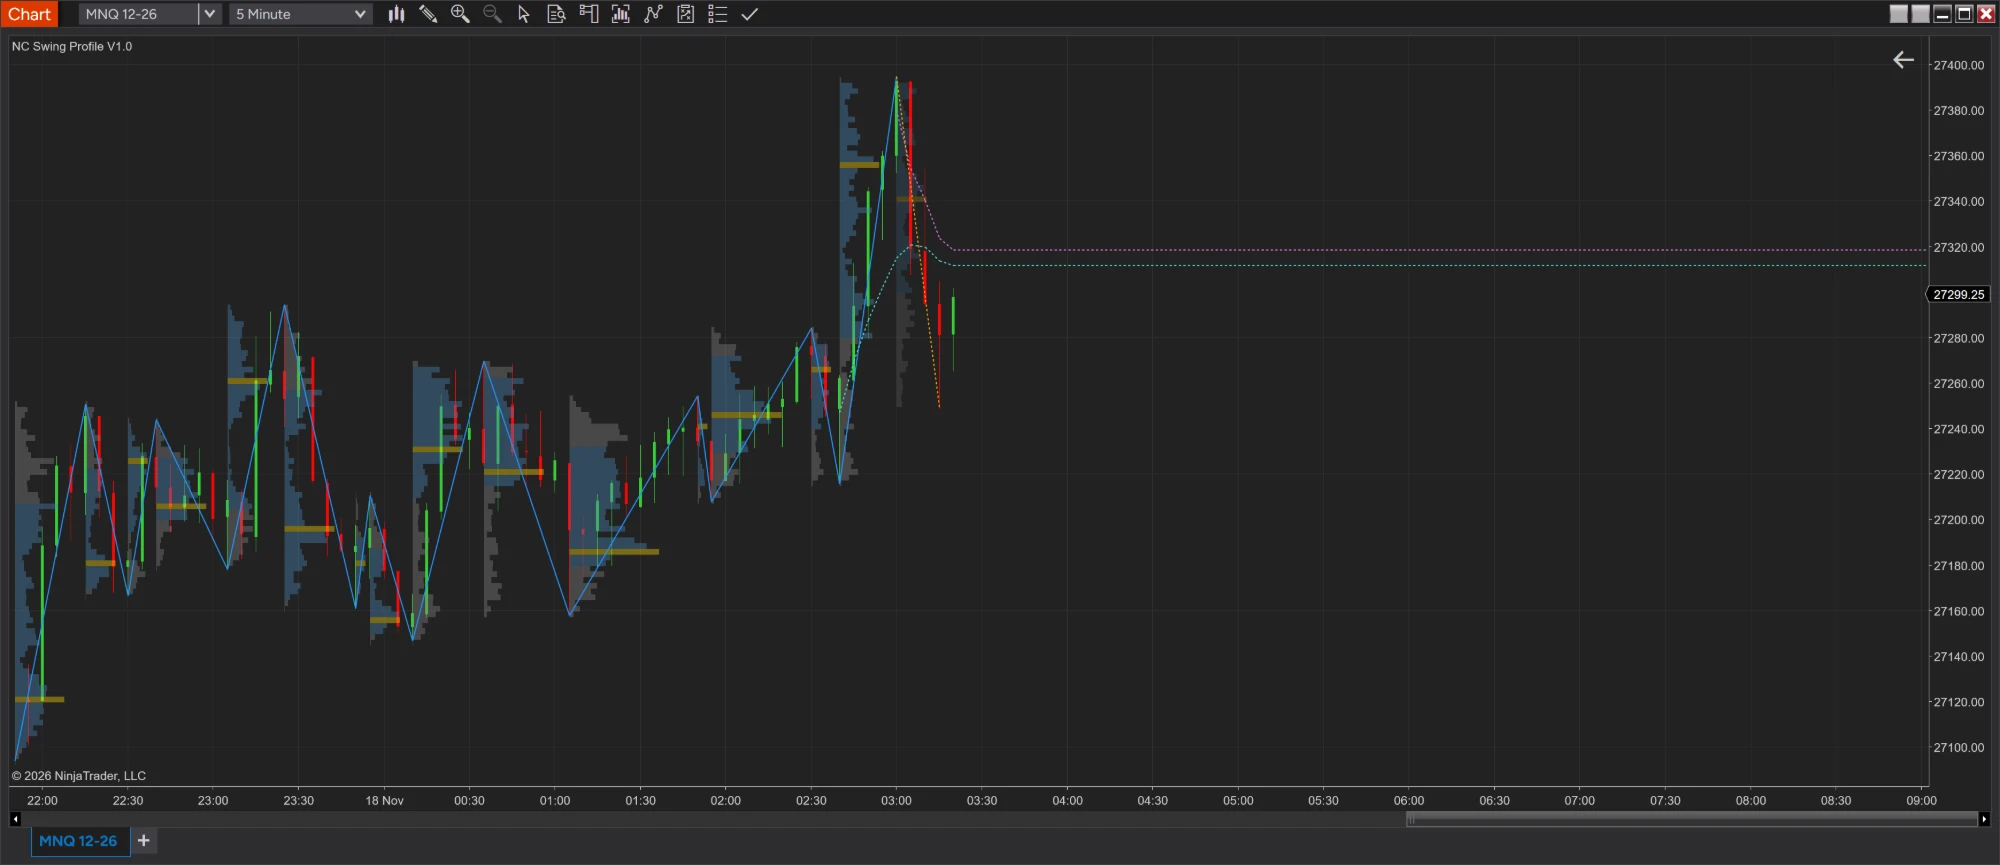
The curves add up many legs of volume.
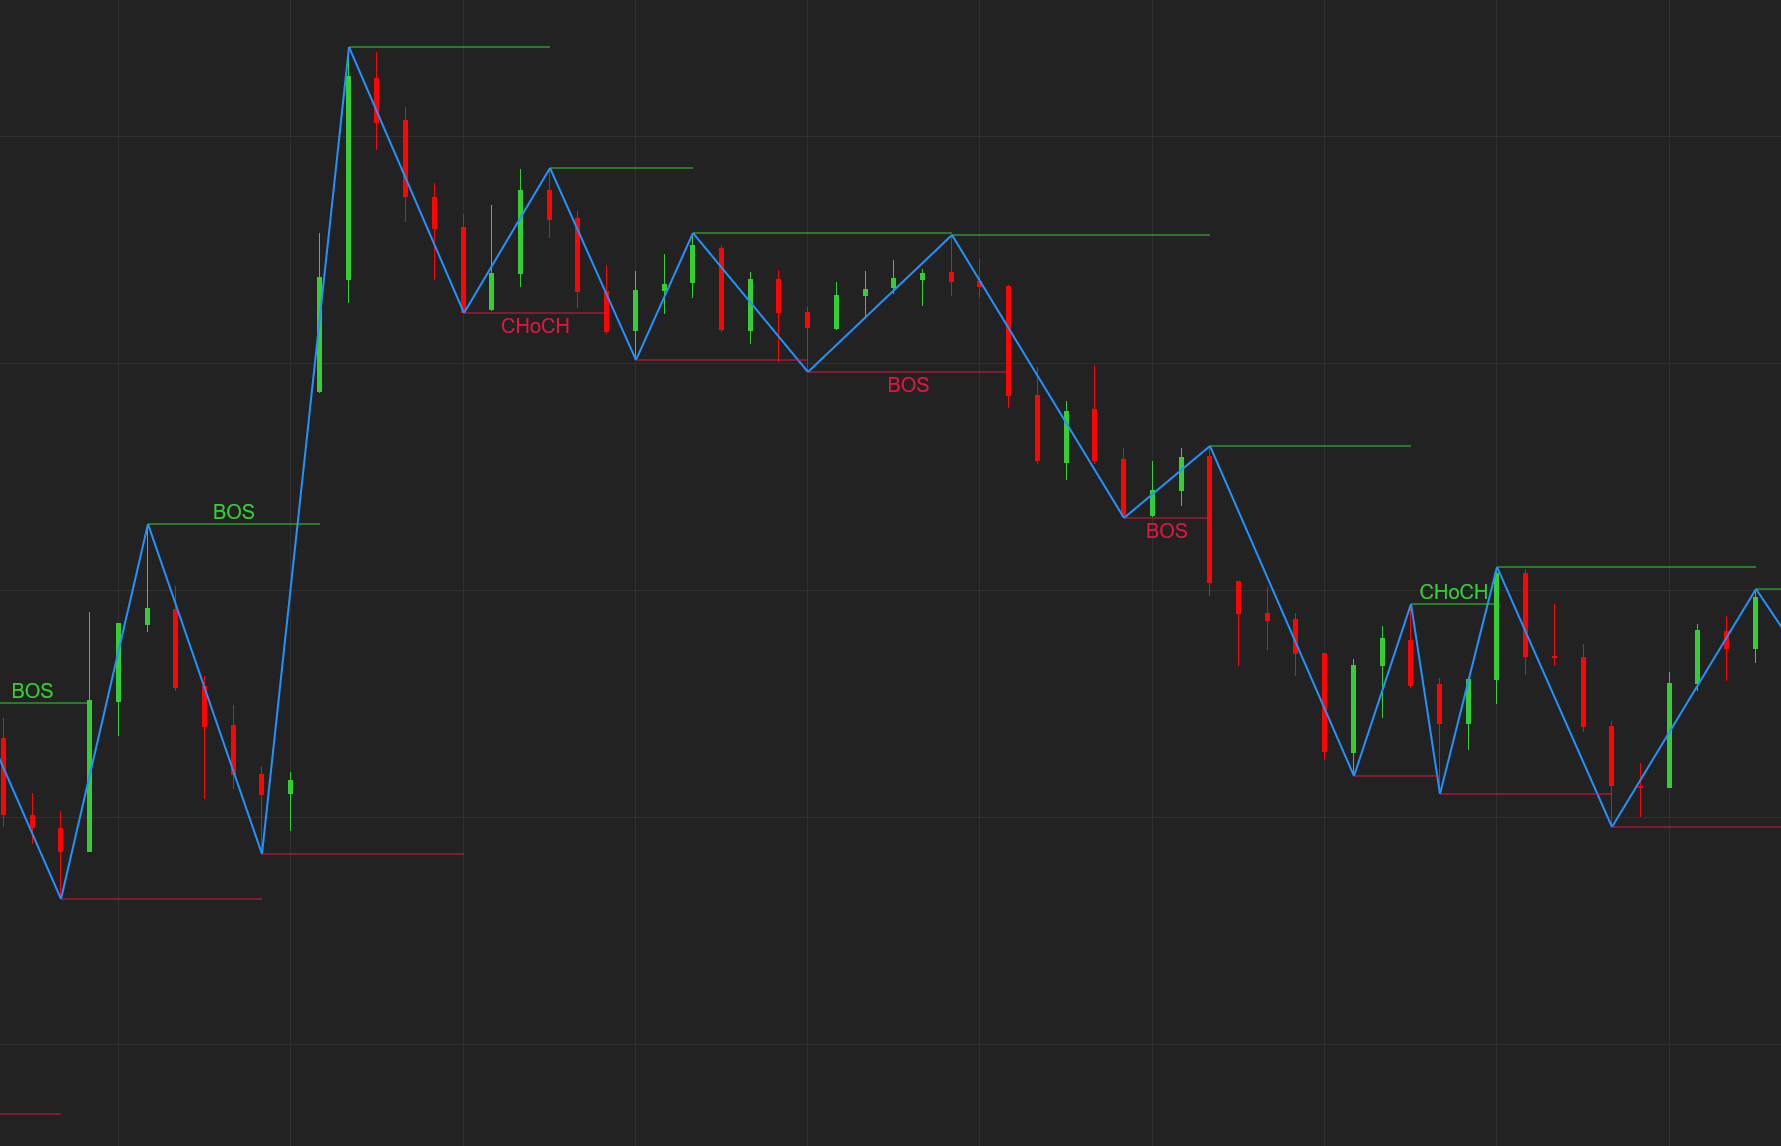
Each finished swing high and low becomes a level until price breaks it, on a close by default or on the wick, past an optional threshold. A break in the direction of the trend is labelled BOS, a break against it CHoCH. Each break is drawn on the bar where it happened.
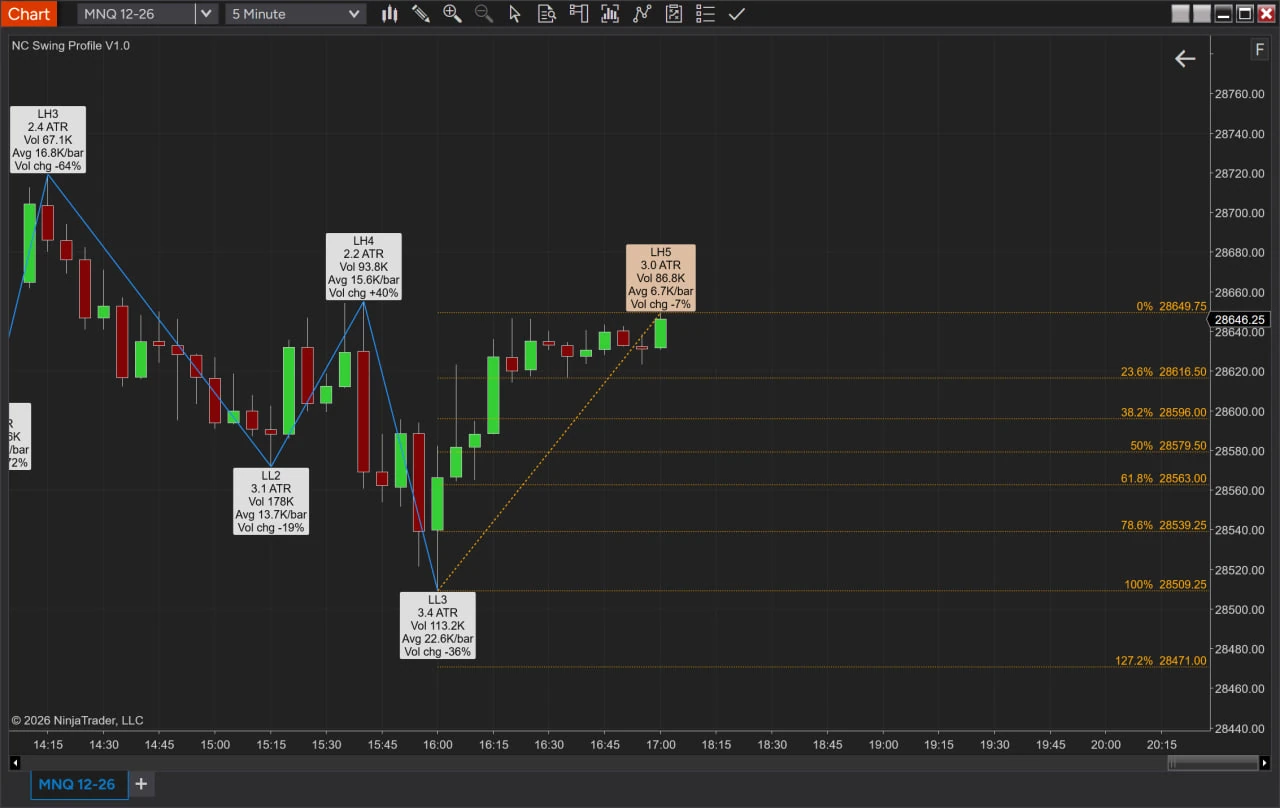
Two checkboxes for the two usual questions. On the forming leg: where could a pullback from here stop? On the last formed leg: how deep is the current move into it, and where does it go if it breaks through? 0% is the leg's end and 100% its start, and the list of levels is yours to edit.
On by default. Orange and dashed, here on LL3 to the live LH5.
Blue and solid, here on LH4 to LL3, with 127.2% and 161.8% past the start.
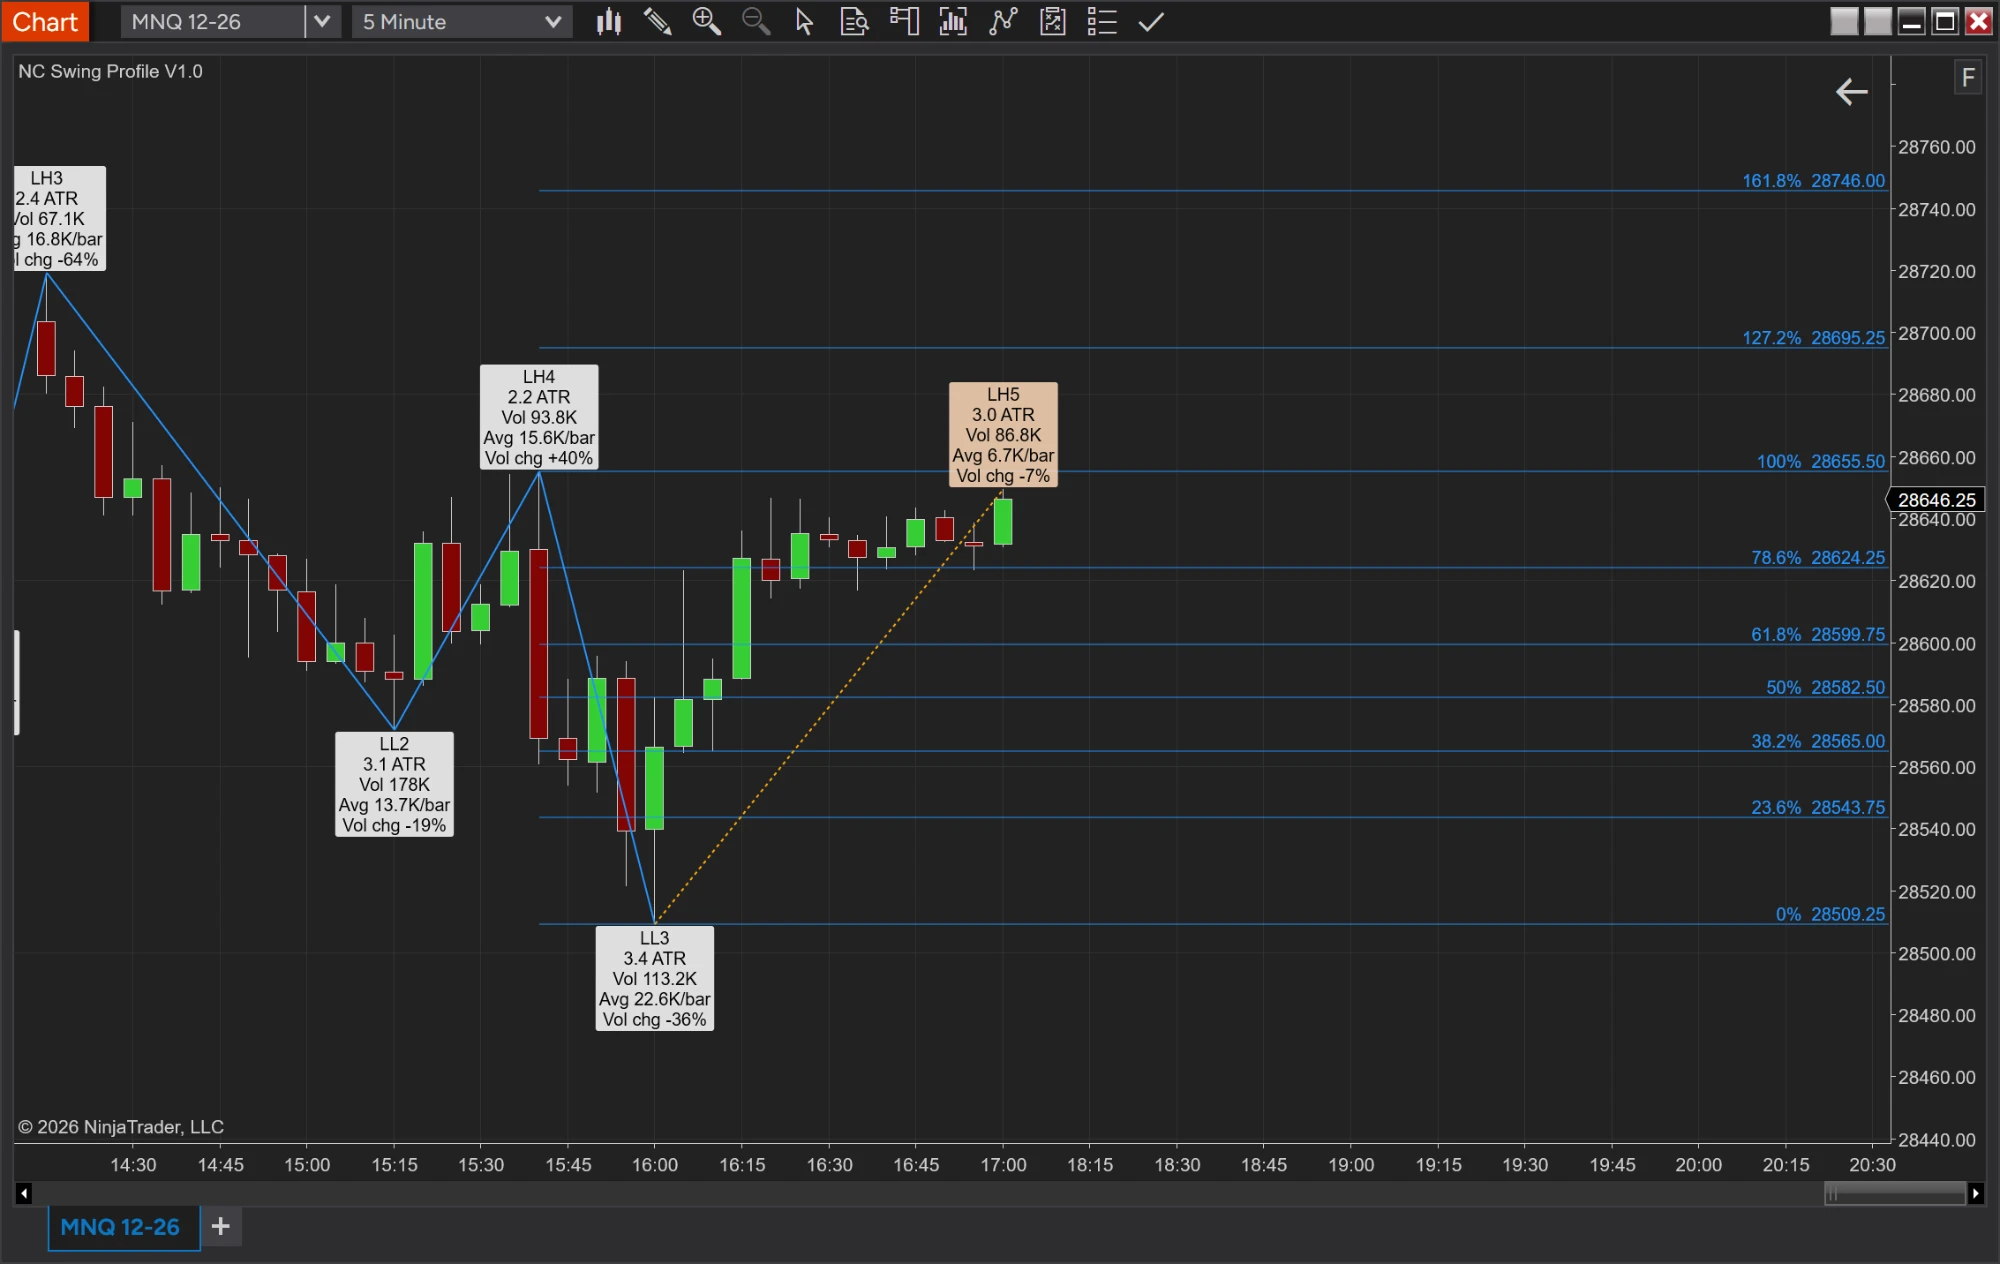
Default levels: 0, 23.6, 38.2, 50, 61.8, 78.6, 100, 127.2, 161.8 and 261.8%. These charts also show the size in ATR, the average volume per bar and the volume change rows.
Alert On Swing when a swing high or low is confirmed, and Alert On Break for every BOS and CHoCH, up or down. They fire in realtime, once per bar, and stay off until you switch them on.
What traders use it for
None of these is a signal on its own. They show what traded inside each move, so you can judge it for yourself.
A POC near the top of an up leg means most of its volume traded high. Near the bottom, the move ran on thin volume.
A finished leg's POC that price hasn't come back to keeps running right. Traders watch these as levels price may return to.
The fib on the formed leg and the Ret % row show how much of the last leg a pullback has given back.
A higher high on weaker delta gets Div ▼. Vol chg and V/t show a leg that needed more volume to go less far.
How it compares
We checked 16 paid swing and structure tools for NinjaTrader 8. Some are rented by the month, several are tied to one machine, and none advertises its source code. NC Swing Profile is one payment, and you get the C# source code to keep and change.
The other paid tools in the table cost €175 to $1,497 to own, or €25 to $147 a month to rent. Two of them give no refunds.
None of the 16 paid NinjaTrader 8 swing and structure tools we checked advertises its source code. Here you get the whole C# file: read it, change it, add what you need with AI like Claude, and keep it.
| NC Swing Profile | TradeDevils TDU Market Structure & SMC | ninZa Zigzag Swing Pro | TradeDevils Orderflow ZigZag | UppDnn Swing Toolkit 8 | Nordman BOS & CHoCH | NinjaTrader ZigZag and Swing (built in) | |
|---|---|---|---|---|---|---|---|
| Price and license | |||||||
| Price | $149one-time, no subscriptionFull C# source included | $449 lifetime, or $55 a month | $225 perpetual (Black Friday price) | $225 lifetime | $1,497 lifetime, or $147 a month for all UppDnn tools | €175 lifetime, or €25 a month for all Nordman tools | Comes with NinjaTrader 8 |
| License | Any machine, no activation | One active machine; 7-day trial | +$50 per extra license; no refunds | 7-day trial | No refunds; $147 for a 30-day trial | Tied to your email and first PC | Part of the platform |
| C# source code | Full source, no license check | Not mentioned | Not mentioned | Not mentioned | Not mentioned | Not mentioned | Viewable in the NinjaScript Editor |
| Swings | |||||||
| Swing detection | Pivot or HiLo; deviation in ticks, points, percent or ATR | Fractal, or PriceAction by ATR or ticks | Minimum swing length in ATR or ticks | ATR-based | Span, ticks or percent | Swing strength, with weak and strong swings | ZigZag: points or percent. Swing: bar strength |
| Close-based swings | High/Low or Close | — | — | — | — | — | ZigZag: High/Low or one input series |
| The forming leg | Drawn apart: dotted, with its own boxes and profile. Confirmed swings never repaint | — | — | Tags confirmed peaks and valleys | — | — | Last leg is provisional; ZigZag is "only meaningful" on bar close |
| Structure labels | HH, HL, LH, LL with a count (HH2) | Trend and HH/LL labels | Swing type at each point (Lower High, Higher Low...) | HH, HL, LH, LL and a structure count | Bars and swings colored by HH/HL bias | HH, LH, EH, LL, HL, EL | — |
| Double tops and bottoms | DT and DB within a tolerance in ticks | Equal highs/lows markers | Double top/bottom | — | — | Equal highs/lows (EH, EL) | — |
| Volume profile | |||||||
| Volume profile per leg | Every leg, from 1-tick data by default | Per structural move, with POC | — | — | — | — | — |
| Value area per leg | VAH and VAL, 70% by default | Not described | — | — | — | — | — |
| Profile of the forming leg | Live, at half opacity | — | — | — | — | — | — |
| Levels until touched | POC, VAH and VAL of finished legs | — | — | — | — | — | — |
| Delta | Bid/ask delta per row and per leg | — | — | — | — | — | — |
| Numbers on each swing | |||||||
| Leg size | Ticks, points, percent, ATR or dollars | — | Swing length | No numeric labels listed | Points or ticks, and dollar value | — | — |
| Volume, bars and duration | All three, each on its own switch | — | Volume, bar count and duration | — | Volume, bar count, days and time | — | — |
| Retracement | Ret % against the leg before | — | Retracement | — | Fib ratio against earlier swings | — | — |
| Speed, average volume per bar, volume change, volume per tick | All four | — | — | — | — | — | — |
| Divergence | Delta divergence at HH and LL | — | — | Divergence markers at swing extremes | — | — | — |
| Levels and tools | |||||||
| Breakout levels | BOS and CHoCH; close or wick; threshold | BOS and CHoCH, multi-timeframe | Active and inactive swing levels | — | Lines where a swing or bias will be broken | BOS and CHoCH; close or high/low per event; threshold in ticks, points or percent | — |
| Swing-anchored VWAP | From the last swing high and low | — | — | — | — | — | — |
| Fibonacci | On the forming and the formed leg, with your own levels | 6 retracement levels, also as plots | — | 50% and 61.8%, on a validated swing or the active leg | Auto-Fibonacci and Fib time targets | — | — |
| Alerts | Swing confirmed, BOS and CHoCH | Audio, on structure breaks | — | Visual and audio | Price-alert lines with sound and email | Configurable | — |
| For strategies | |||||||
| Strategy plots | 22 plots | 16 plots | — | Direction, divergence, No Interest, structure count | Market Analyzer support | Direction, BOS/CHoCH events, swings, MFE/MAE | Swing highs and lows, with bar lookups |
| Code API | Swings, leg profiles, levels, breaks and fibs | — | — | — | — | — | — |
| Data it needs | No Tick Replay; loads its own tick data | Tick Replay and a Rithmic/CQG feed recommended | — | Real-time ^TICK data | — | — | The chart's bars |
Prices and features as listed on each vendor's own product page, and NinjaTrader's help guide, on 16 November 2026, during Black Friday sales at some vendors. "—" and "not mentioned" mean the page doesn't say. Product names belong to their owners.
Settings
Pivot finds highs and lows with Hill Size bars on each side (2 by default) and an optional Minimum Drop. HiLo runs a zig-zag on every bar's high and low.
How far price must turn to start a new leg: in ticks, points, percent or a multiple of ATR (ATR Period 14).
Close makes the swings run from close to close. Breakouts, touches, VWAP and the profile still read the real bars.
The data each profile is built from: 1-tick bars for exact volume and delta, or seconds or minutes bars, whose volume is spread over each bar's range. Those give the leg's shape, not the exact volume at each price.
How many ticks make one row. Raise it for bolder bands on wide legs.
How much of the leg's volume the value area holds, and how much of the leg's width its busiest row fills.
Which lines are drawn across each leg, and which of them keep running right until price touches them: None, POC, VAH, VAL, VA or All.
Tint every row by its buying and selling, from the bid and ask stored with each trade, or by uptick and downtick.
Show leg sizes in ticks, points, percent, ATR or dollars. Dollars is the leg's distance × point value × contracts.
Adds DT or DB when a swing is this close to the previous one on its side. 0 turns it off.
Anchored VWAPs from the last swing high and low. Lookback (legs) covers more legs; Collapse Into One draws a single curve.
Swing levels until price breaks them, on the close or the wick, past a threshold in your deviation unit, with BOS and CHoCH labels.
Fibs on the forming legs and on the last formed leg. Levels: 0, 23.6, 38.2, 50, 61.8, 78.6, 100, 127.2, 161.8 and 261.8%, or your own list.
Alert On Swing and Alert On Break, in realtime, once per bar.
Every color, width, line style, font size and opacity is a setting too.
Who it's for
You trade HH, HL, LH and LL, BOS and CHoCH, and want every swing's size, speed and volume on the chart.
You read POCs and value areas, and want one for every move, with naked POCs that wait for price.
You want swings, profiles, delta and levels as values your NinjaScript can read, and code you can extend.
For strategies
22 transparent plots show in the Data Box and in your NinjaScript. Each holds what was known when its bar closed and is never rewritten later. 0 means nothing yet.
| # | Plot | Value |
|---|---|---|
| 0 | Direction | +1 leg up, -1 leg down |
| 1 | SwingConfirmed | +1 on the bar a swing high is confirmed, -1 for a low |
| 2–3 | LastSwingHigh LastSwingLow | The last confirmed swing prices |
| 4 | StructureHigh | +N = HH N, -N = LH N |
| 5 | StructureLow | +N = HL N, -N = LL N |
| 6 | BarsSinceSwing | Bars since the last confirmed swing |
| 7–10 | LegSize LegVolume LegBars LegDelta | The last finished leg's size (in the deviation unit), volume, bars and delta. From a strategy, LegDelta needs Calculate Delta = true. |
| 11–13 | LegPoc LegVah LegVal | The last finished leg's profile |
| 14–15 | UntouchedPocAbove UntouchedPocBelow | The nearest naked POC above and below price |
| 16 | BreakEvent | +2 BOS up, +1 CHoCH up, -1 CHoCH down, -2 BOS down |
| 17 | Trend | +1 or -1, from the last break |
| 18–19 | BreakLevelHigh BreakLevelLow | The live breakout levels |
| 20–21 | VwapFromHigh VwapFromLow | The swing VWAP values |
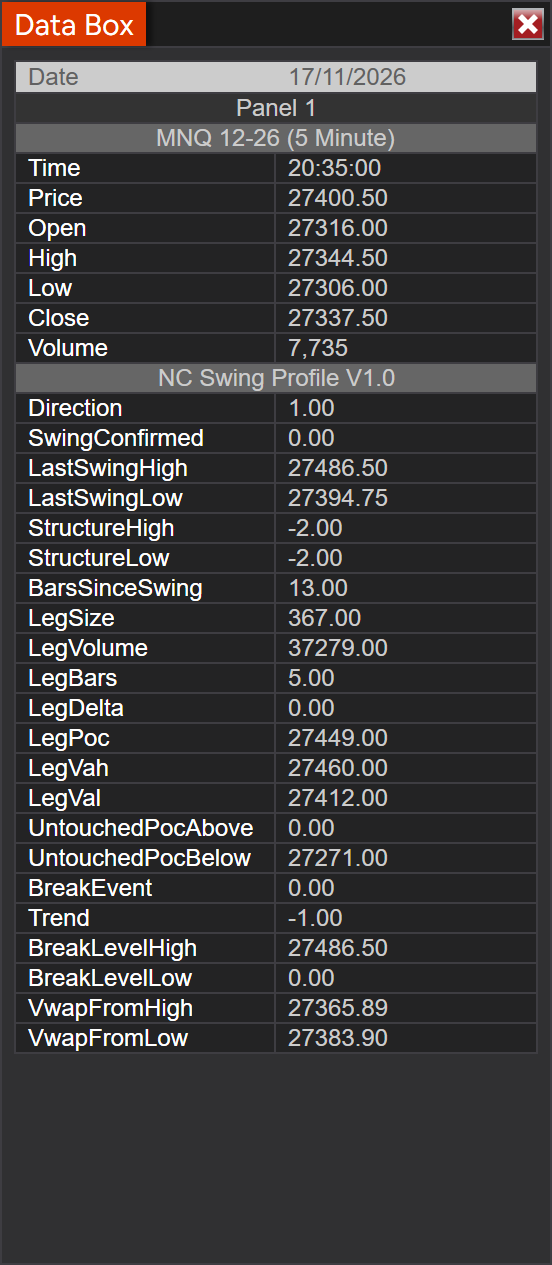
The 22 plots in NinjaTrader's Data Box.
Read more than the plots can hold:
FinishedSwings and OpenSwing: price, time, structure and count, size, volume, bars, duration, delta, POC, VAH, VAL, retracement, volume change, double, divergenceGetLegProfile(index): every row's low, high, volume and deltaUntouchedLevels, BreakLevels, FibLevelsMode, Swing Source, Deviation Unit, Deviation Value, ATR Period, Hill Size, Minimum Drop, Profile Source, Source Granularity and Calculate Delta, so a strategy gets the same swings and the same leg delta as your chart.
A strategy that hosts the indicator adds the same data series: a 1-tick series with the defaults. The user manual shows the few lines it takes.
Before you buy
Four things to know before you load it.
Make it yours
No subscription, no license check, no waiting for a vendor to add the feature you need. Every swing, profile and level is open to your own code through 22 plots and a code API. Describe a change to an AI assistant like Claude, compile with F5, and test it in Market Replay.
Want to see how a volume profile is built in NinjaScript? The NinjaTrader Market Profile & TPO course walks through it, with its source code.
You ask: “Go long on a CHoCH up after a double bottom, and aim for the nearest naked POC above.”
// in your strategy's OnBarUpdate, for BarsInProgress 0
var lastLow = _swing.FinishedSwings.LastOrDefault(s => !s.IsHigh);

if (_swing.BreakEvent[0] == 1 && lastLow != null && lastLow.IsDouble
    && _swing.UntouchedPocAbove[0] > 0)
{
    SetProfitTarget(CalculationMode.Price, _swing.UntouchedPocAbove[0]);
    EnterLong();
}
FAQ
Confirmed swings never do. Swings are committed only on closed bars, so a confirmed swing is the same live and after a reload. The part that isn't confirmed yet is drawn apart: a dotted orange leg with light-orange boxes, and a grey line for the move since the last swing. In Pivot mode a swing is confirmed Hill Size bars after it, as with any pivot. The strategy plots hold what was known when each bar closed and are never rewritten.
No. The indicator loads its own tick data for the profile, or seconds or minutes bars if you choose. Your data connection must provide historical tick data for the days you load. The swings themselves only need the chart's bars.
From the volume of every bar in the leg, both swing bars included, at 1-tick resolution by default, grouped into rows of Row Granularity ticks. The POC is the busiest row. The value area grows from it until it holds 70% of the leg's volume.
Each trade is compared with the bid and ask NinjaTrader stored with it: at or above the ask counts as buying, at or below the bid as selling, and in between as volume only. Delta Method Tick uses uptick and downtick instead. Delta needs Profile Source Ticks with Source Granularity 1.
A break in the direction of the current trend is a BOS, a break of structure. A break against it is a CHoCH, a change of character. The trend is the direction of the last break, and the first break is labelled BOS. Breaks count on the close by default, or on the wick.
Yes. 22 plots cover direction, swings, structure, leg size, volume and profile, naked POCs, breaks, trend and VWAP, and a code API returns every swing, leg profile, level and fib. Ten settings are strategy parameters, including Calculate Delta for leg delta and divergence. A strategy that reads profile values adds the same data series; the user manual shows how.
Yes, two: Alert On Swing when a swing high or low is confirmed, and Alert On Break for every BOS and CHoCH. They fire in realtime, once per bar, and are off until you switch them on.
The swings work on any NinjaTrader 8 chart. For the profile, pick a source finer than the chart's bars; on tick, range or Renko charts, that's a Ticks source. On daily and longer charts, or when the source is coarser than the bars, the profile uses the chart's own bars and says so with a note.
The full C# source code as a NinjaScript add-on you import into NinjaTrader 8, and a PDF user manual. It has no license check, and it's yours to keep and change.
No. Describe the change in plain words to an AI assistant like Claude, compile with F5 in the NinjaScript Editor, and test it in Market Replay before you trade with it.
149.00 USD
Choose the License Type That Fits Best
Check Out What Else is Available